ADA could be gearing up for a massive pump in the coming weeks, with some analysts eyeing gains of over 130%.
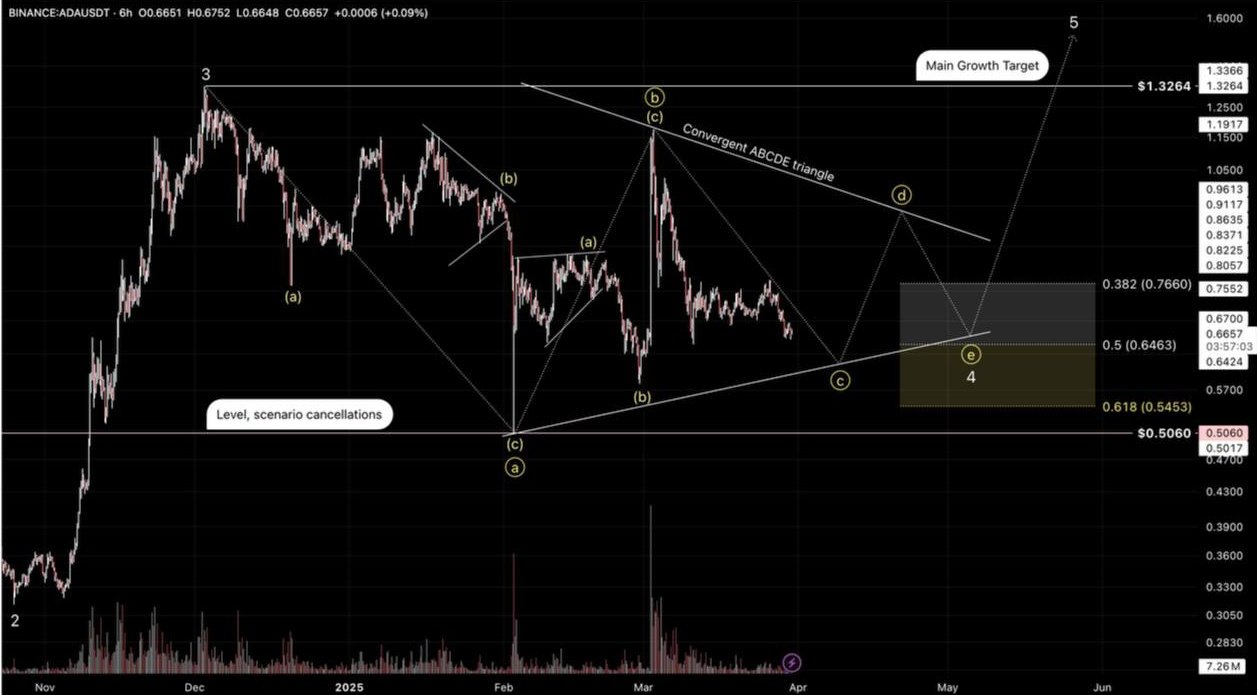
In a March 31 X post, pseudonymous analyst RJT.WAGMI, with 124K followers, pointed out that Cardano appears to be forming a classic “ABCDE” triangle pattern, a type of consolidation structure often seen before major breakouts.
 Source: X/RJT_WAGMI
In this setup, the price moves in five distinct waves labeled A through E within a tightening range, typically ending with a strong move in one direction.
Per the analyst, ADA is currently in the middle of the C wave, a downward leg, but once it completes the D and E waves, a strong breakout to the upside could follow.
RJT added that a bounce from the 0.5–0.618 Fibonacci retracement zone could serve as the launchpad for a move toward $1.5.
“This is where OGs buy,” he noted, implying that experienced traders tend to accumulate when this pattern forms.
Fellow analyst CW echoed a similar sentiment. He noted that ADA was respecting its long-term trend and was hovering near the lower boundary of a symmetrical triangle pattern, a classic consolidation setup where price compresses between converging trend lines.
Per the analyst, once ADA breaks above the convergence zone, there’s little to no resistance until $1.9. “Everything will start in an instant,” he wrote, pointing out continued net buying as a bullish sign.
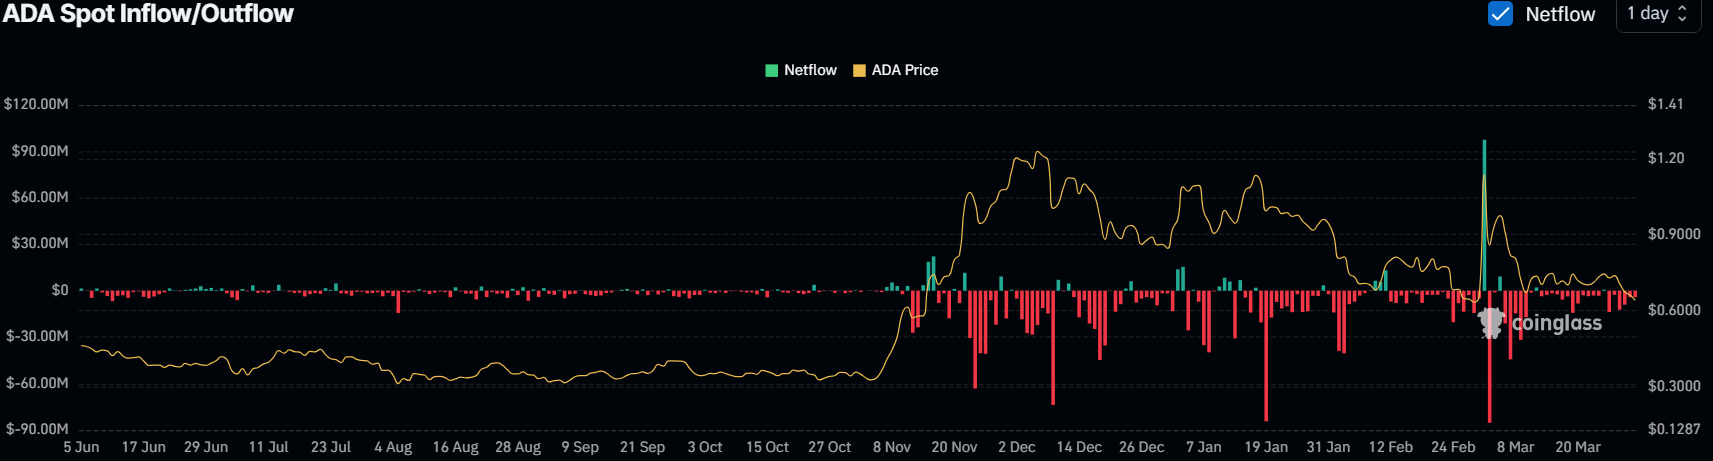
According to CoinGlass data, investors have mostly been accumulating the altcoin, with net outflows showing up on most days since March 3. This means more tokens are being taken off exchanges than added, a sign of strong investor belief in its long-term potential.
 Source: CoinGlass
Adding another layer to the bullish case, analyst Master Kenobi compared ADA’s current price action to its behavior in August–September 2024. Back then, the token saw a strong rally after it went through a lengthy consolidation period.
With ADA not posting a new low following its Feb. 3 dip to $0.49, just like in the previous cycle, he believes a similar breakout could unfold in May, potentially pushing the price as high as $2.5.
However, at presstime, ADA was still under bearish pressure, with its price down 6.2% over the past day at $0.64 while its market cap stood at $23.3 billion.
ADA technical analysis
On the 1-day/USDT price chart, the 50-day moving average stood above the 200-day moving average, a bullish setup that signals ongoing sustained momentum and strengthens the case for a potential breakout.
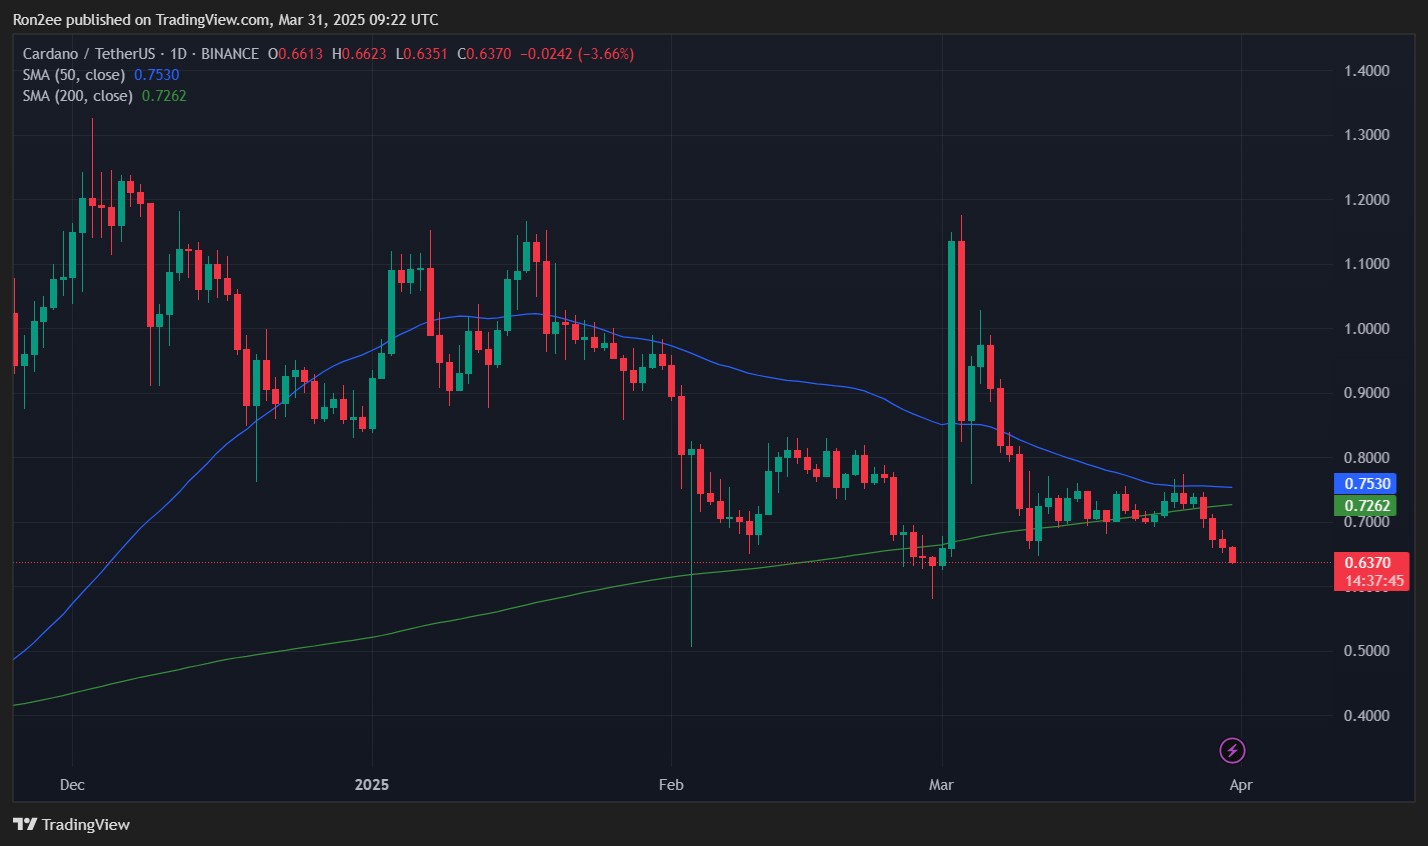 ADA price, 50-day and 200-day SMA — March 31 | Source: crypto.news
The Supertrend indicator has fallen below the price level and has turned green, another sign of a potential reversal in trend soon.
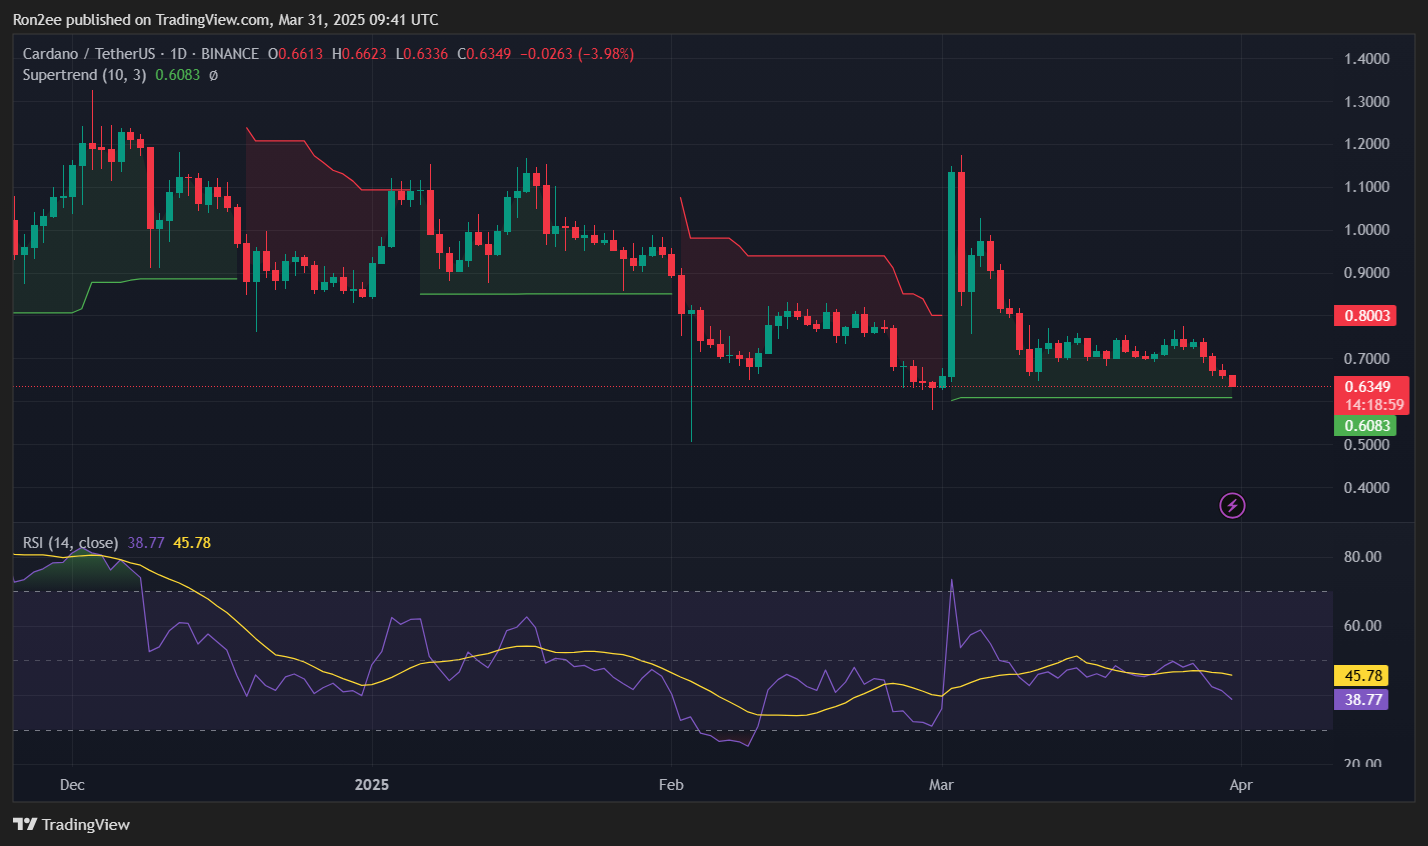 ADA Supertrend and RSI chart — March 31 | Source: crypto.news
Its Relative Strength Index, dropping to $3,9, looks primed to hit the oversold levels soon, which could encourage bulls to step in and push the price higher.
Meanwhile, ADA’s MVRV Z-score has dropped to 0.0077 — its lowest since early March — indicating that the average holder is nearing breakeven. This level often marks a point where selling pressure eases and accumulation begins, increasing the likelihood of a price rebound if market sentiment shifts.
However, looking at data from IntoTheBlock, ADA’s price correlation with Bitcoin at press time stood at 0.79, indicating a strong positive relationship over the past 30 days. This means that ADA’s next move would hinge on Bitcoin, which has been on a downtrend ahead of President Donald Trump’s U.S. reciprocal tariffs.
When writing, Bitcoin (BTC) was trading at $81,484, down roughly 7% over the past 7 days.
Disclosure: This article does not represent investment advice. The content and materials featured on this page are for educational purposes only.


 English (US) ·