 1 month ago
26
1 month ago
26
Bitcoin’s price has struggled to maintain stability above $102,000 in recent days, and data shows this is due to an apparent imbalance between selling pressure and fresh demand.
On-chain data from CryptoQuant reveals that while long-term holders have been actively taking profits, the market is showing limited capacity to absorb their sell-offs. This is a contrast to previous phases of the bull run, where rising demand was able to offset increased long-term holder activity.
Rising Long-Term Holder Selling Pressure Mirrors Past Bull Cycles
Data from on-chain analytics platform CryptoQuant, which was initially shared by Julio Moreno, head of research at CryptoQuant, shows an interesting change in dynamics among Bitcoin holder activity that could shape the cryptocurrency’s next move.
Julio Moreno explained that long-term holder (LTH) selling is a normal pattern in bull markets as investors take profits when Bitcoin approaches or surpasses all-time highs. The CryptoQuant data shows that the 30-day sum of LTH spending, represented by the purple line in the chart image below, has been increasing since early October.
This behavior follows previous bullish rally phases, such as those seen in early and late 2024, when profit-taking coincided with expanding demand, and so Bitcoin pushed to new record prices.
The chart accompanying Moreno’s post shows green areas representing periods of positive apparent demand growth and red areas indicating contraction. During January to March 2024 and November to December 2024, LTH selloffs occurred as demand expanded.
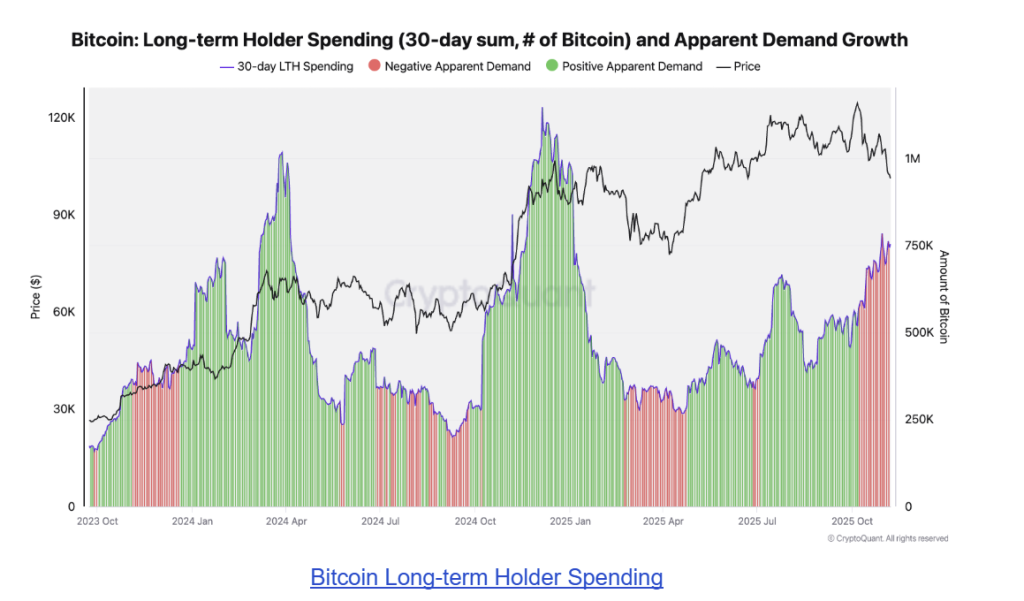
Bitcoin Long-term Holder Spending
Since October 2025, however, that trend has reversed. Even as LTH selling increased, demand has entered a red zone, showing that the market’s ability to absorb this selling pressure has weakened. This has coincided with Bitcoin’s struggle to sustain its position above $102,000, suggesting that price growth might be losing momentum.
Sustained Weak Demand Could Delay Next Rally
Moreno noted that the critical factor to watch isn’t just the volume of long-term holder sell-offs but whether demand growth can keep pace.
When demand is strong, the influx of supply from long-term holders often drives healthy consolidation before another price surge. In contrast, when demand falls behind, the result tends to be prolonged corrections or sideways movement.
A large portion of that demand now comes from Spot Bitcoin ETFs, which have seen a sharp slowdown in inflows. Data from SosoValue shows that US-based Spot Bitcoin ETFs ended last week with net outflows of $558.44 million on Friday, November 7, one of the largest single-day outflows in weeks.
Unless Bitcoin’s apparent demand begins to recover in the coming weeks and LTH sell-offs continue, then this might continue to weigh on price action and postpone the next leg of Bitcoin’s rally. In this case, we might continue to see Bitcoin consolidating between $101,000 and $103,000 for the rest of November.
At the time of writing, Bitcoin is trading at $101,655, down by 0.6% in the past 24 hours.
Featured image from Unsplash, chart from TradingView


 English (US) ·