
 1 month ago
32
1 month ago
32
The information provided in this article is for informational purposes only and does not constitute financial advice. Cryptocurrency investments carry a high degree of risk. Always conduct your own research.
Bitcoin just smashed through $65,000 on cooling US inflation. Here's the price analysis, macro triggers and what ETH, XRP, SOL and DOGE are doing.
Bitcoin has finally punched through the $65,000 wall that capped every rally for the past month. After grinding sideways for weeks, BTC exploded off its early-July lows and reclaimed the level that bulls have been staring at since mid-June. The move is fast, it's clean, and it's got a real macro story behind it — which is exactly why traders are suddenly paying attention again.
Let's break down what happened, why it happened, and where the charts say we're going next.
Advertisement

Why did Bitcoin break above $65,000?
The short answer: inflation cooled and the Fed rate-hike fear evaporated. Bitcoin pushed toward $65,000 as a sharper-than-expected slowdown in US inflation weakened the case for another near-term Federal Reserve rate move. June CPI came in soft, and that single data point flipped market psychology from defensive to risk-on almost overnight.
But this isn't a one-catalyst story. Several things stacked up at the same time:
- Relief bounce. The stream of bad news that dragged BTC under $58,000 on July 1 — including chatter around Michael Saylor trimming part of his stack — has dried up. When the bad news stops, price tends to snap back.
- Regulatory tailwinds. There's growing buzz around a fresh version of the Crypto Clarity Act, plus Circle securing approval to set up a national trust bank. Regulatory clarity is rocket fuel for institutional confidence.
- ETF inflows. Weekly Bitcoin ETF inflows have been running north of $1.3 billion, a strong signal that big money is accumulating, not fleeing.
- Seasonality. July has historically been a reliably green month for Bitcoin. The calendar was quietly on the bulls' side the whole time.
From a low near $58,000 at the start of the month to above $65,000 now, that's a move of roughly 15% in two weeks. Not bad for a coin everyone had written off as "boring" ten days ago.
Bitcoin price analysis: what the chart says
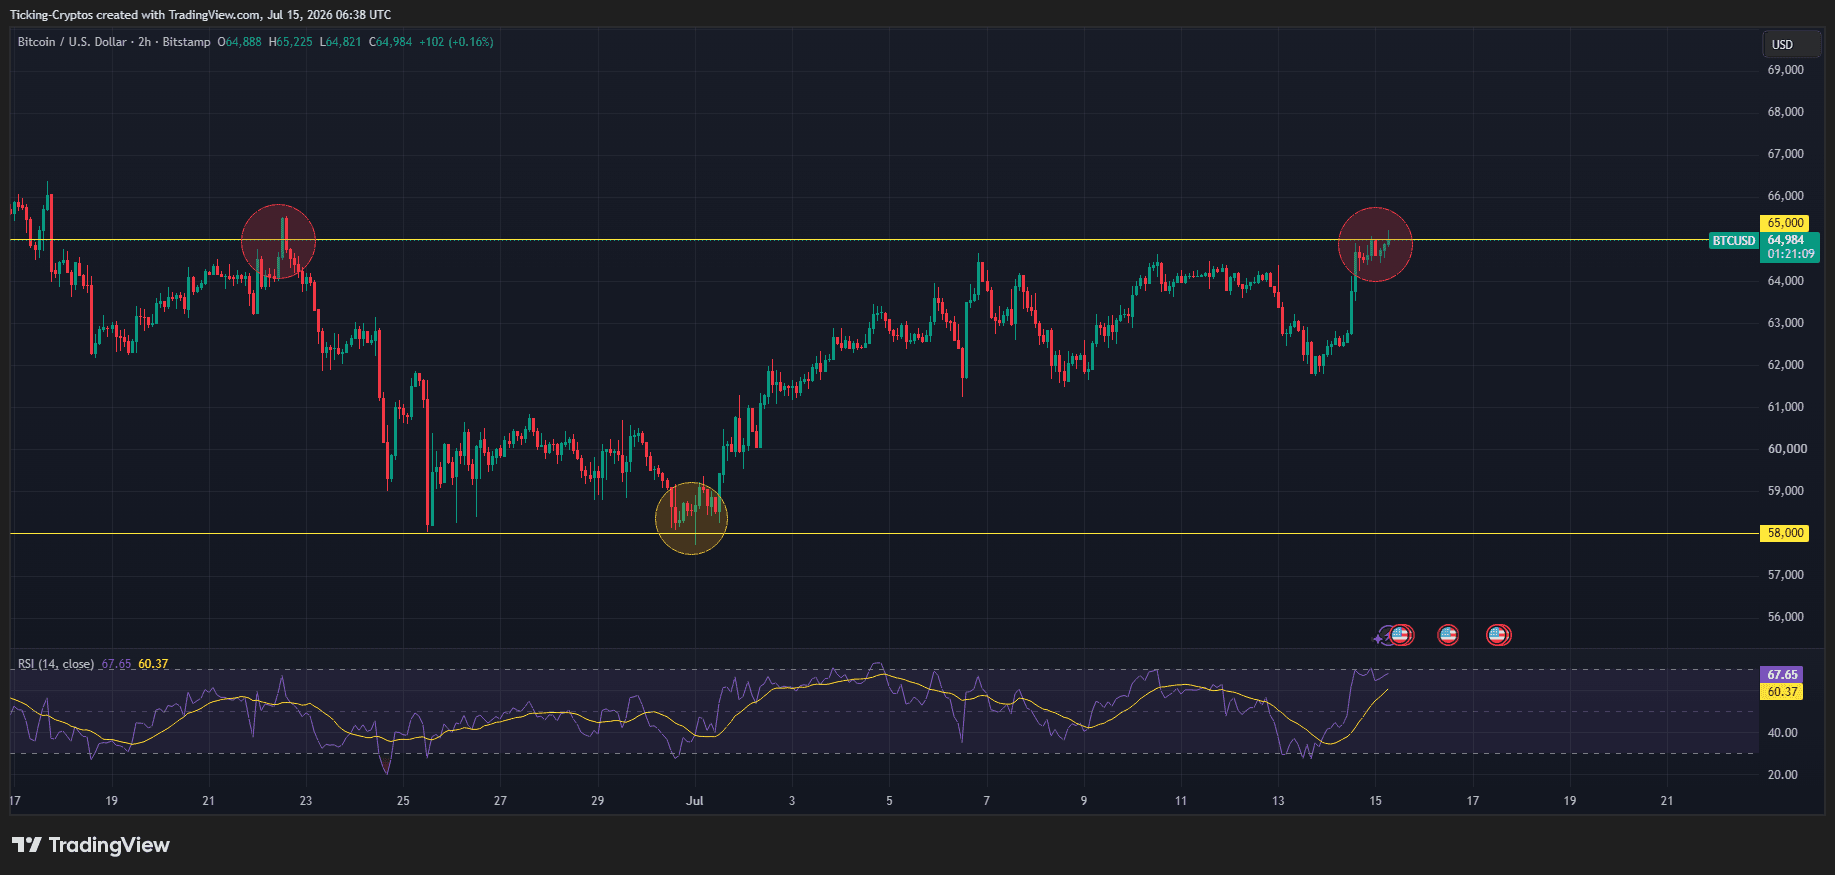
On the 2-hour chart, the structure is textbook. BTC spent the back half of June and early July carving out a base, put in a clear higher low around the $58,000 zone (the level marked as major support), and has now driven straight into the $65,000 resistance that rejected price back in late June.
The key levels to watch:
- $65,000 — the line in the sand. This capped the June rally and is the level BTC is now testing. A clean 2-hour or daily close above $65,000 turns old resistance into new support and opens the door higher.
- $67,300 — the next real obstacle. This was the lower high printed on June 15. To convince anyone that a real trend change is underway, bulls need to take this out. Until they do, this remains "just a bounce" for the skeptics.
- $58,000 — the floor. As long as BTC holds above this, the broader structure stays constructive.
Momentum backs the move: RSI on the lower timeframe has surged toward 67 and is pointing up, showing real buying pressure rather than a limp drift higher. It's not yet screaming "overbought," which leaves room for continuation.
Prediction: If Bitcoin holds $65,000 as support on a retest, the path of least resistance points to $67,300 first, then a run at $70,000, which analysts have flagged as the natural upside target if the $58,000 base holds. The bullish scenario needs that June high taken out to confirm. The bearish scenario is simple: rejection at $65,000, a slip back below, and a re-test of $62,000–$58,000. Watch the reaction at the line — that's where this gets decided.
One honest caveat: some analysts warn the inflation-relief pop may already be fading, and geopolitical risk in the Middle East hasn't gone anywhere. This is a real breakout attempt, not a guaranteed one.
Advertisement

How are ETH, XRP, SOL and DOGE reacting?
Altcoins are riding Bitcoin's coattails — and in several cases outperforming it on the day:
- Ethereum ($ETH): trading around $1,875, up roughly 5–6% on the day. ETH is leading the majors, helped by news that Morgan Stanley pushed forward updated S-1 filings for spot ETH and SOL ETFs. Staking demand keeps grinding higher in the background.
- $XRP: around $1.10, up close to 4%. Social sentiment on XRP has turned notably bullish — though it's worth noting that historically, loud XRP optimism has sometimes preceded pullbacks, so keep expectations measured.
- Solana ($SOL): near $77–78, up around 3–3.7%. SOL is a direct beneficiary of the Morgan Stanley ETF filing story and remains one of the higher-beta plays when risk appetite returns.
- Dogecoin ($DOGE): around $0.074, up roughly 3%. Classic DOGE behavior — it wakes up when Bitcoin runs and the mood turns risk-on.
The broad tape is green: total crypto market cap climbed back toward $2.3 trillion, up nearly 3% on the day, with Bitcoin dominance holding around 56%. When BTC leads and alts follow without dominance collapsing, it usually signals a healthy, BTC-led leg rather than a frothy alt blow-off.
Trading the majors and want regulated access? If you're in Europe, make sure your exchange is MiCA-compliant. Compare the top MiCA-regulated exchanges here to trade $BTC, $ETH, $XRP, $SOL and $DOGE with proper regulatory coverage.
Bottom line
Bitcoin breaking $65,000 is the most convincing move BTC has made in weeks, and it's backed by a genuine macro shift: cooling inflation, fading Fed-hike fears, strong ETF inflows and improving regulatory optics. The technicals agree, with a clean higher-low base and momentum turning up.
The catch is confirmation. Bulls must hold $65,000 and then clear the $67,300 June high to prove this is a trend change and not just the best relief bounce of the summer. Reclaim those levels and $70,000 is squarely in play. Lose $65,000 and we're right back to chopping between $62,000 and $58,000.













 English (US) ·