Bitcoin is flashing strong technical signals, forming both a cup-and-handle and a bullish flag pattern that suggest a potential surge to new all-time highs.
Bitcoin (BTC) has been stuck at the significant resistance level of $107,000 for the past three days. It has jumped by nearly 10% from its lowest point this week.
What’s fueling the latest rally?
U.S. spot Bitcoin ETFs drew $2.2 billion in inflows this week alone—the third consecutive week of net additions. According to SoSoValue data, which represents a substantial increase from the $1.02 billion Wall Street investors accumulated last week.
These ETFs have had net inflows of $4.5 billion this month, down from $5.2 billion in May and $2.9 billion in April. They have had cumulative inflows of $48.87 billion, meaning that the figure could cross the $50 billion milestone in July.
With supply on exchanges at its lowest since 2017, market momentum appears to favor the bulls, setting the stage for a possible breakout above the $111,900 peak.
Bitcoin chart analysis
BlackRock’s IBIT leads the charge. The ETF added over $52 billion in assets. It now holds $74.5 billion, making it one of the biggest ETFs in the U.S. Fidelity’s FBTC has $12 billion in inflows and now has $21.5 billion in assets.
The soaring Bitcoin demand is happening at a time when the supply on exchanges has continued falling. Santiment data shows that there are 1.21 million coins on exchanges, its lowest level since December 2017.
 BTC price chart | Source: crypto.news
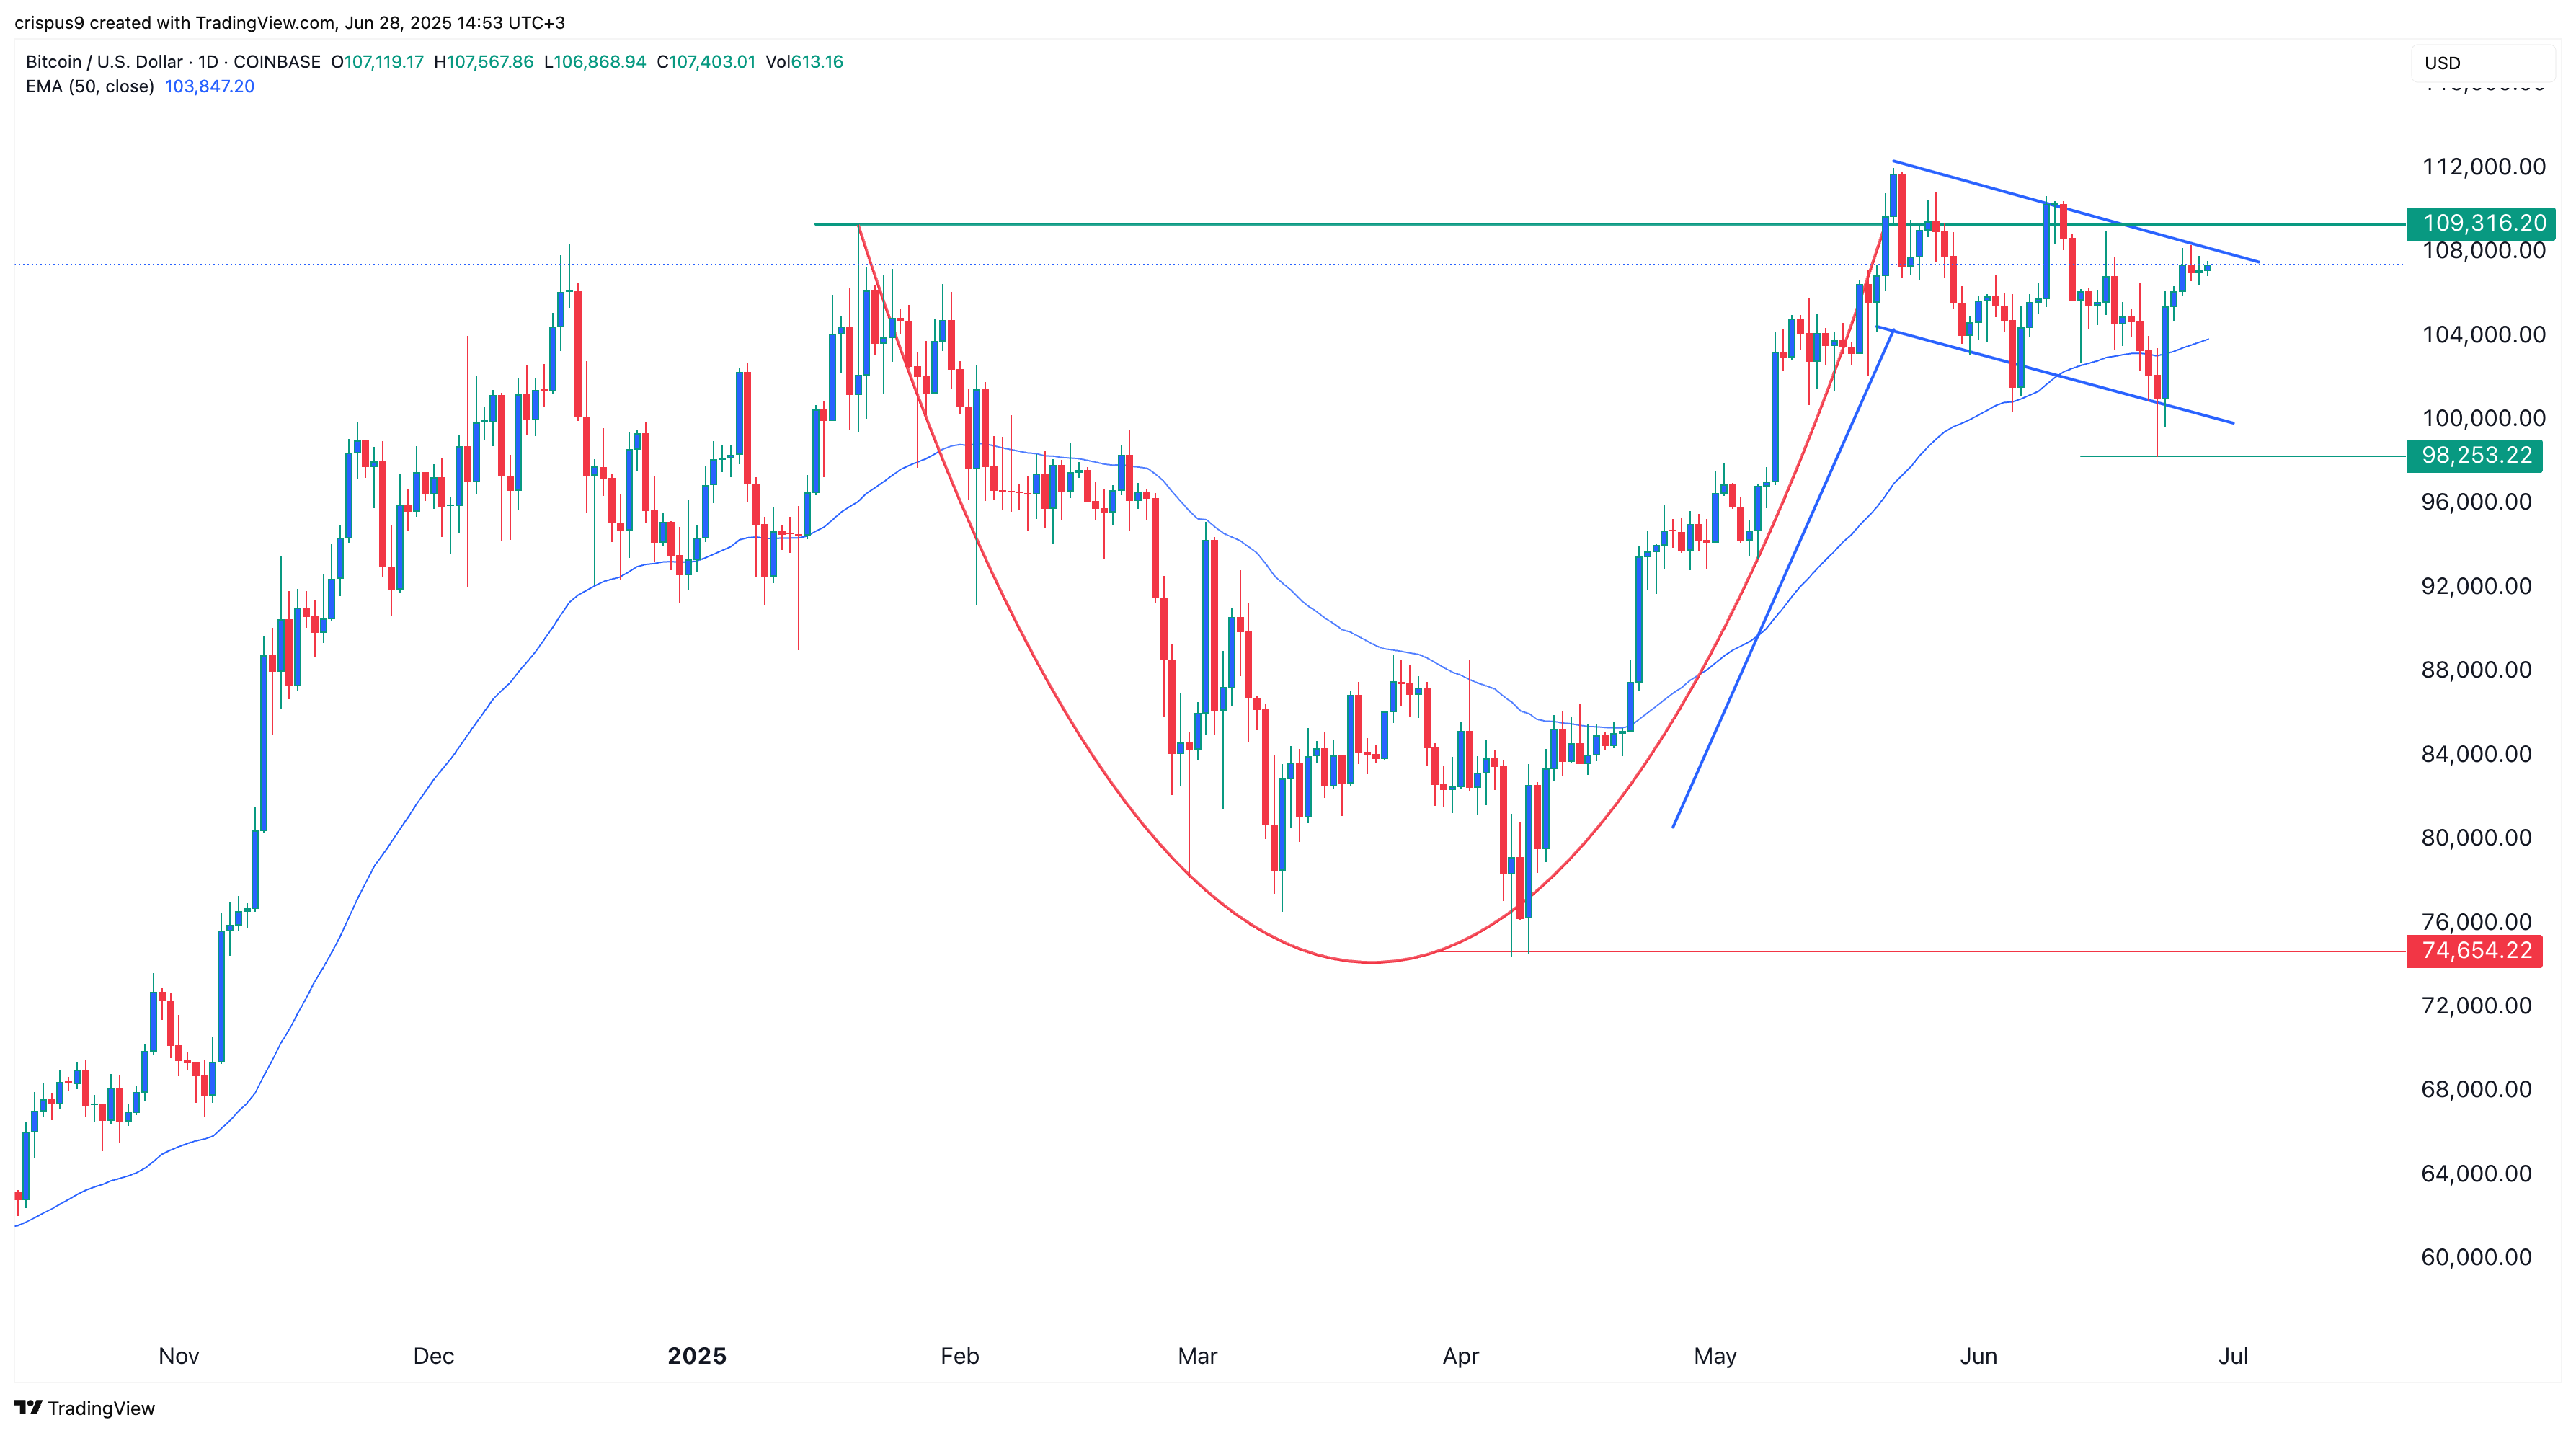
The daily chart indicates that Bitcoin has rebounded over the past few days, rising from a low of $98,253 to $107,400. It remains above the 50-day and 100-day Exponential Moving Averages, a sign that bulls are in control.
Bitcoin has formed a bullish flag pattern, one of the most positive signs in technical analysis. This pattern comprises a vertical line and a descending channel, which is part of the flag.
It has also formed a cup-and-handle pattern, consisting of a rounded bottom and a descending channel. This channel is part of the bullish flag.
Therefore, the most likely scenario is that it rebounds and possibly reaches its all-time high of $111,900. A move above that level will indicate further upside, potentially reaching the psychological point at $115,000.


 English (US) ·