
content, reviewed by leading industry experts and seasoned editors. Ad Disclosure
The crypto market was left in awe as the price of Bitcoin experienced a sudden surge, bringing the flagship asset dangerously close to the $100,000 mark. With the recent bounce, hopes for a retest of the current all-time high and beyond have reemerged. However, a crucial supply cluster continues to stand in the way.
A Fresh All-Time High Beckons For Bitcoin
Bitcoin’s price is gaining sharp upward traction as it retests the $98,000 price mark on Wednesday, a level last seen in November 2025. On-chain data shows that the crypto king is once again edging toward uncharted territory, with market structure pointing to a clear path toward a new all-time high.
However, there is a significant barrier between present levels and price discovery: a dense supply cluster created by investors who have previously made purchases in the same range. This range was highlighted by Glassnode, a leading on-chain data platform, after examining the BTC Long-Term Holder Cost Basis Distribution Heatmap.
Data from the key metric shows a dense cost-basis cluster between the $93,000 and $109,000 price range, which is forming a substantial overhead supply zone. The supply zone serves as a technical and psychological barrier where a large number of holders may be waiting to take profits or quit at breakeven, resulting in concentrated resistance.
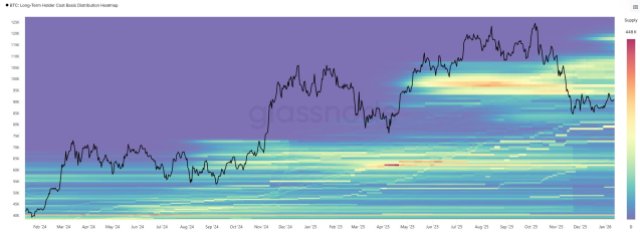 Source: Chart from Glassnode on X
At this level, any sustained push higher must first absorb this supply, with a decisive breakout above the range. If Bitcoin is able to absorb this overhead supply and push through it decisively, momentum could pick up pace quickly. Glassnode noted that this crucial range is usually expected to reopen the path toward a new all-time high for Bitcoin over the longer term.
According to Glassnode in another post, BTC has ushered in the new year with constructive momentum, printing two higher highs and extending its value toward the $98,000 price level. However, the platform stated that the leg up currently runs directly into a historically supply zone.
BTC Market Is Displaying Deleveraging Signals
Looking at Bitcoin’s current action from an on-chain perspective, the flagship asset is starting to show signs of deleveraging. This deleveraging indicates that excess speculation is being removed from the market after a period of high leverage and aggressive positioning.
Coin Bureau’s report shared on X points to a sharp decline in BTC Open Interest (OI) from $15 billion in October to $10 billion today, as leveraged traders get flushed out. The drop represents an over 30% decrease within the period.
Interestingly, these deleveraging phases have often preceded major market bottoms, making this a critical moment for BTC. Nonetheless, should BTC continue to fall, more leverage is expected to still get wiped out.
At the time of writing, the Bitcoin price was trading at $96,247, demonstrating a 1.29% increase in the last 24 hours. Data from CoinMarketCap shows that trading volume is down despite the bullish price action, dropping by more than 3% in the past day.
Featured image from Pngtree, chart from Tradingview.com
Editorial Process for bitcoinist is centered on delivering thoroughly researched, accurate, and unbiased content. We uphold strict sourcing standards, and each page undergoes diligent review by our team of top technology experts and seasoned editors. This process ensures the integrity, relevance, and value of our content for our readers.


 English (US) ·