Bitcoin has fallen back toward $64,000 after a hawkish Federal Reserve outlook erased a relief rally driven by easing Middle East tensions, with traders now debating whether support near $64,000 can prevent a deeper retracement toward June lows.
Summary
- Bitcoin fell from $66,315 to $64,103 after the Fed projected additional rate hikes for 2026.
- Liquidation heatmaps show major leverage clusters near $64K–$65K, increasing downside volatility risks.
- Analysts warn that weak spot demand and continued ETF outflows could expose the $60K support zone.
According to data from crypto.news, Bitcoin (BTC) climbed to an intraday high of $66,315 on June 17 before reversing sharply and dropping to as low as $64,103 during early June 18 trading.
The reversal followed the Federal Reserve’s decision to keep interest rates unchanged at 3.50%–3.75%, though policymakers surprised markets by projecting additional rate hikes in 2026. The announcement arrived just hours after reports of a preliminary U.S.-Iran agreement had fueled a risk-on move across crypto and equity markets.
Before the Fed decision, traders had welcomed news that Washington and Tehran were moving toward a framework that could reopen the Strait of Hormuz and ease pressure on global energy markets.
Oil prices had already retreated sharply from recent highs, helping risk assets recover. Bitcoin’s initial rally also triggered a wave of short liquidations, with more than $150 million in bearish positions forced out of the market as BTC price pushed above $66,000.
Away from macro headlines, institutional demand has remained under pressure. U.S. spot Bitcoin ETFs have continued to record net outflows over recent weeks, reducing a key source of structural demand that supported previous rallies.
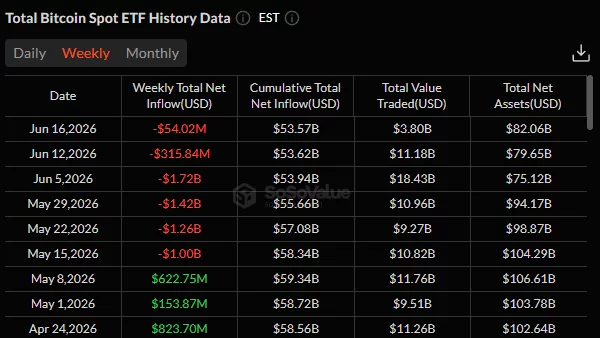 Source: SoSoValue
Capital has also gravitated toward traditional risk assets, particularly artificial intelligence-related equities and newly listed high-growth companies such as SpaceX, which have attracted significant speculative flows from institutional investors.
Technical structure leaves Bitcoin trapped beneath major resistance
The daily chart shows Bitcoin’s rebound stalled almost precisely at the 78.6% Fibonacci retracement level near $64,230, calculated from the decline between the May peak around $82,939 and the June low near $59,136.
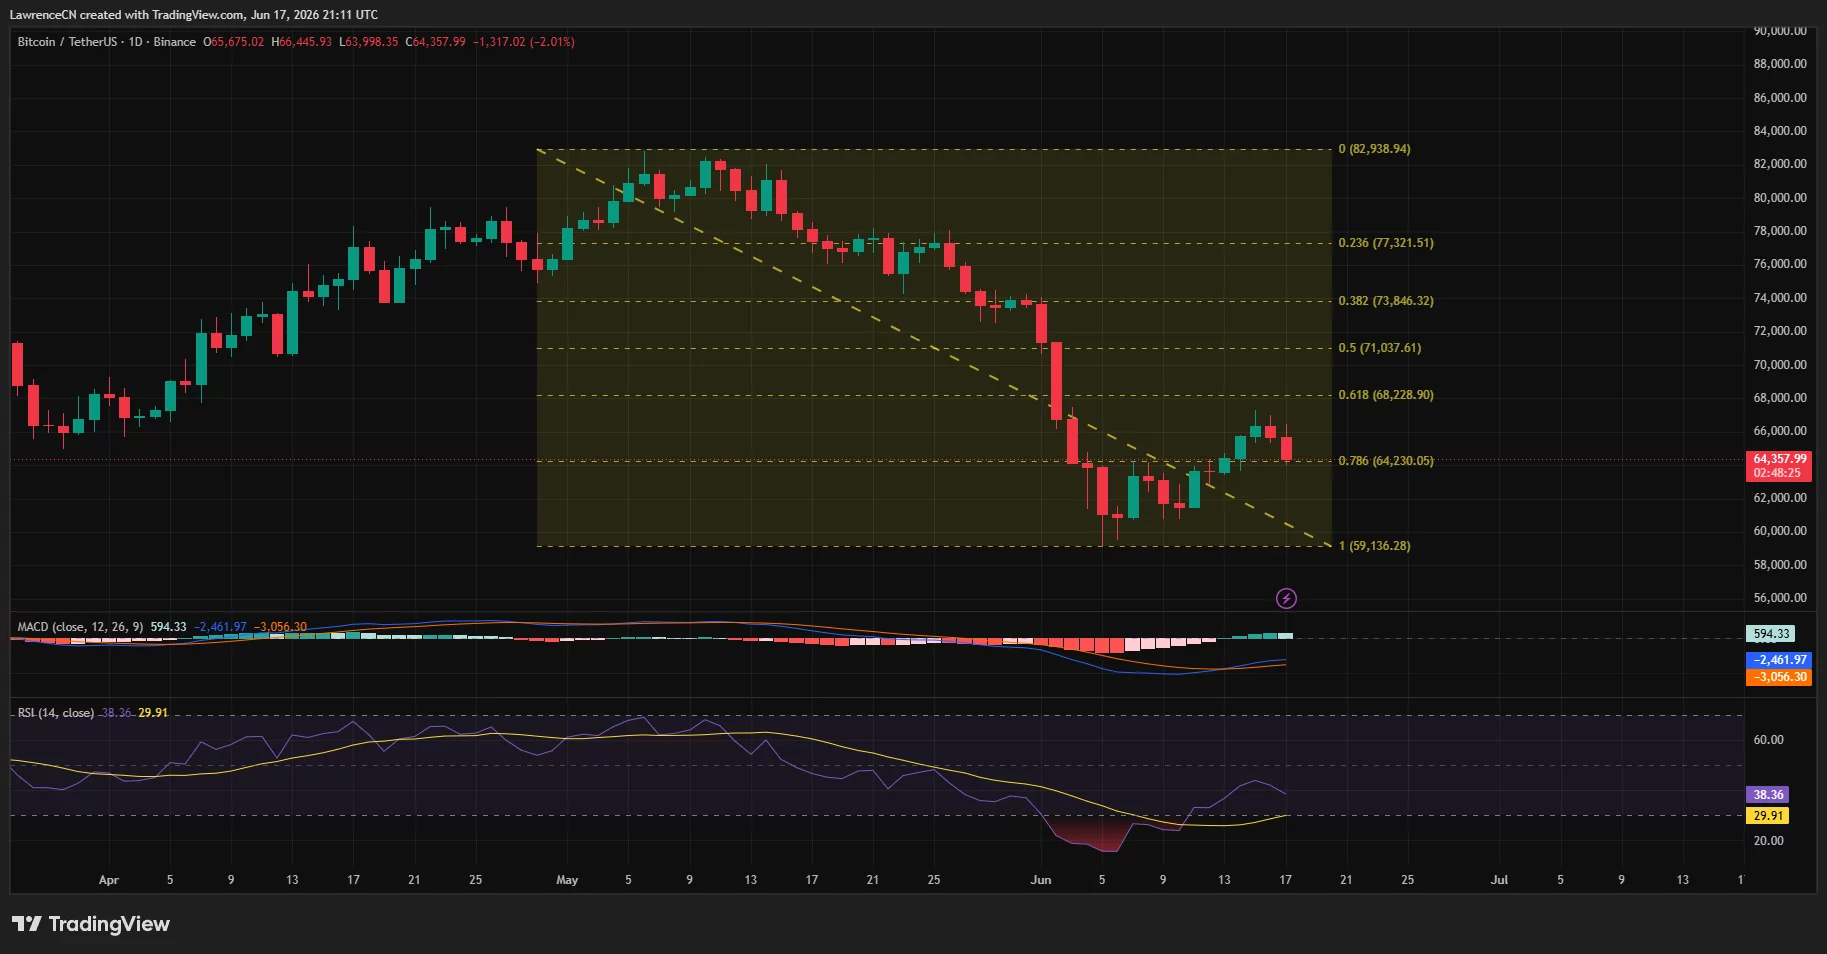 Bitcoin daily price chart — June 18 | Source: crypto.news
The larger 61.8% retracement level sits much higher near $68,229, reinforcing the importance of the $68,000–$69,000 zone as a major resistance area should buyers regain control.
Momentum indicators remain mixed. The daily MACD has begun recovering from deeply negative territory, but the histogram remains below levels typically associated with trend reversals. Meanwhile, the daily RSI sits below 40, showing that bearish momentum still dominates despite last week’s rebound from sub-$60,000 levels.
On the four-hour chart, Bitcoin has retreated back to test an ascending trendline that has supported price since the June 5 low. The asset also remains below the Supertrend resistance level near $67,113, a threshold that has repeatedly rejected recovery attempts throughout June. BTC price currently trades just above Supertrend support around $64,500, placing the market at a technically important inflection point.
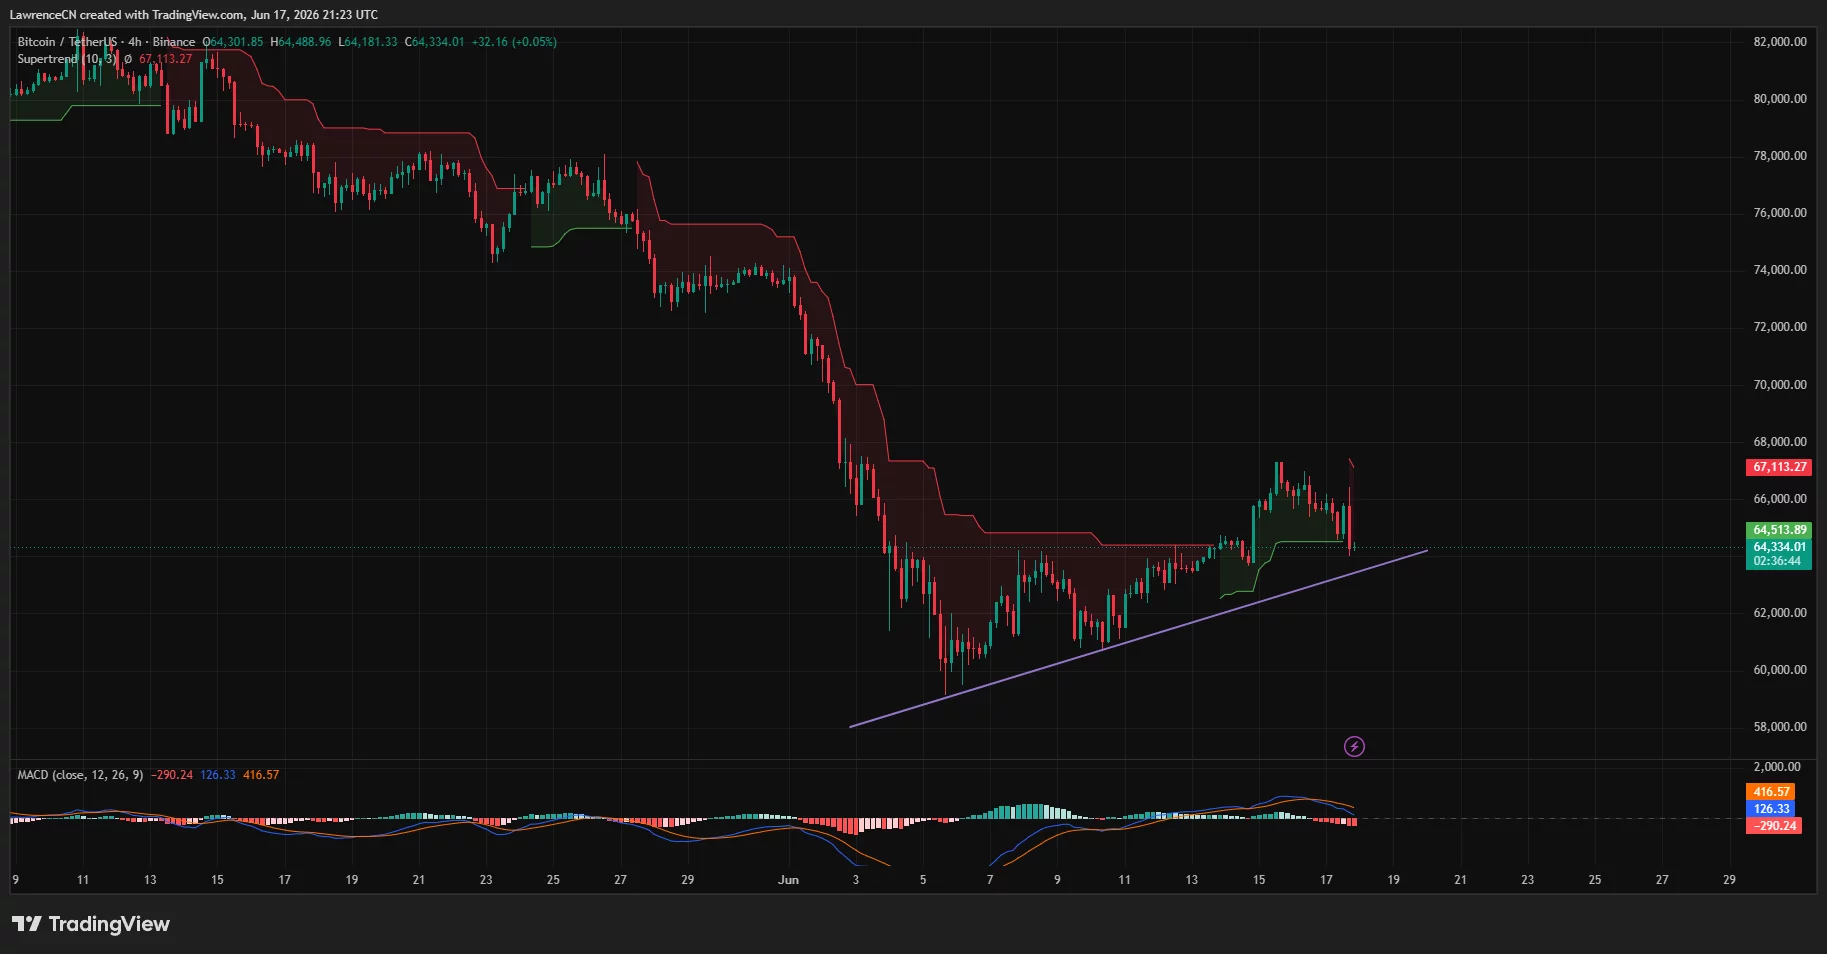 Bitcoin 4-hour price chart — June 18 | Source: crypto.news
Derivatives positioning adds another layer of risk. CoinGlass liquidation heatmaps show one of the largest nearby liquidity clusters concentrated between $64,500 and $65,000, where heavily leveraged long positions accumulated during the latest rebound. Bitcoin’s drop through that area triggered a cascade of liquidations and exposed additional liquidity pockets near $64,000.
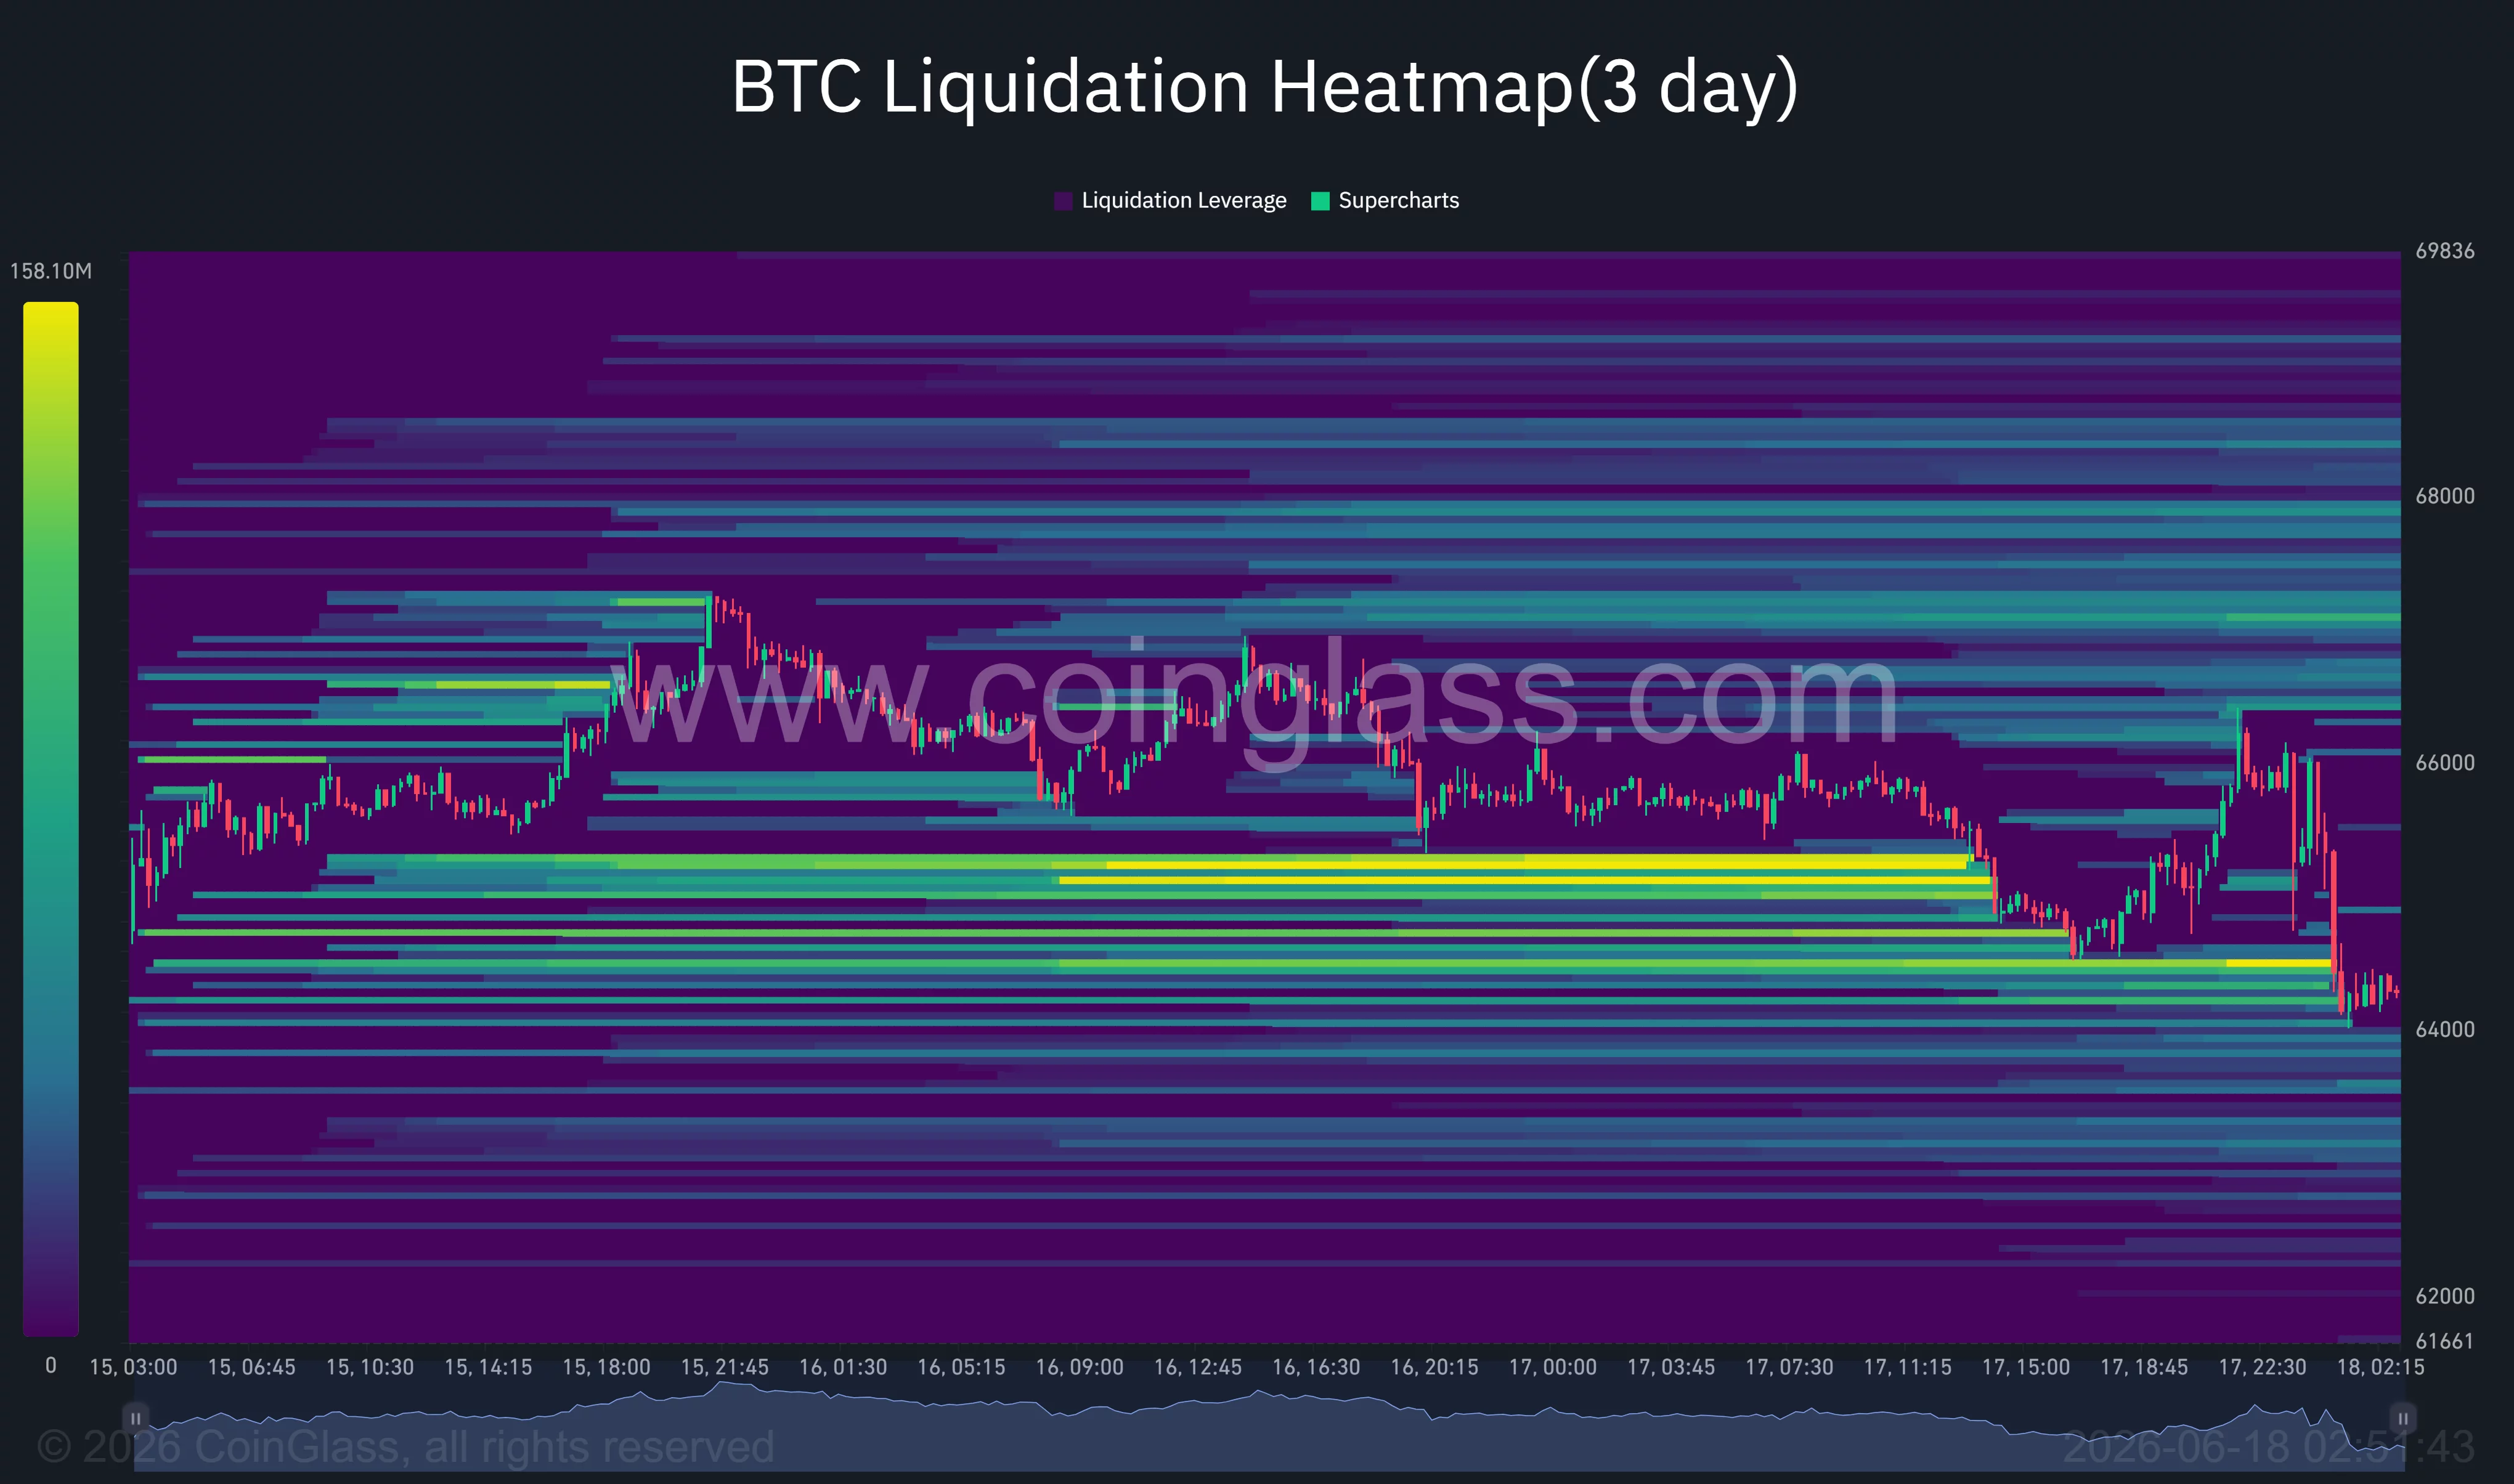 Bitcoin liquidation heatmap | Source: CoinGlass
According to analyst Ardi, the current rally bears similarities to the move that preceded Bitcoin’s previous decline from $83,000.
“If we don’t see spot volume play catch up, there’s very little doubt in my mind we’ll eventually see a similar outcome.”
Ardi noted that perpetual futures activity has continued to rise while spot demand remains near cycle lows, suggesting leverage rather than fresh capital has driven much of the recent recovery.
Loss of $64K support could expose June lows
Several traders now view the $64,000 region as the market’s most important short-term support level. Commenting on the latest breakdown, analyst Wealthmanager argued that a sustained move below that zone could reopen the path toward $60,000.
Liquidation data supports that view. Below current prices, large leverage concentrations remain visible between $60,000 and $61,000, creating a potential magnet if selling pressure accelerates. At the same time, Bitcoin’s failure to reclaim the Supertrend resistance and its position beneath major moving-average resistance clusters leaves bulls with limited room for error.
A recovery above $66,000 would likely force another round of short liquidations and bring the $68,000–$69,000 resistance region back into focus. Until then, traders remain caught between deteriorating macro conditions, persistent ETF outflows, and a derivatives market still carrying elevated leverage.
Disclosure: This article does not represent investment advice. The content and materials featured on this page are for educational purposes only.


 English (US) ·