 1 month ago
28
1 month ago
28
Bitcoin’s market structure is showing a split signal: institutional demand through ETFs is accelerating, while short-term holders are still selling into exchanges at a loss. That divergence is helping explain why BTC has held up near the $70,000 area even as retail stress remains visible in on-chain data.
In his latest Morning Brief, Axel Adler Jr. said US spot Bitcoin ETFs absorbed 62,986 BTC over the past 30 days, equal to $11.3 billion in net inflows between February 24 and March 25. Over that stretch, cumulative ETF holdings rose to 1,326,874 BTC. The pace of buying also picked up materially. Adler said the 7-day simple moving average of ETF flows reached 3,288 BTC per day, versus 1,256 BTC for the 30-day average, meaning the current weekly pace is running about 2.6 times above the monthly trend.
That institutional bid has so far outweighed episodic outflows and coincided with a move in Bitcoin’s price from $64,100 to $71,307 over the same month. Adler’s read is that ETF demand is providing a floor, but not a clean breakout signal on its own. For that to happen, he argued, the short-term flow trend needs to stay positive for several more sessions and the market still needs to avoid a fresh run of negative macro-driven ETF days.
The other side of the picture is far less constructive. Adler said short-term holders remain firmly in a loss-realization regime, with loss-side flows to exchanges at 15,500 BTC per 24 hours. Total short-term holder inflows to exchanges stood at 35,200 BTC per day, a sign that selling pressure remains active even if it has not yet reached the kind of extreme typically associated with final capitulation.
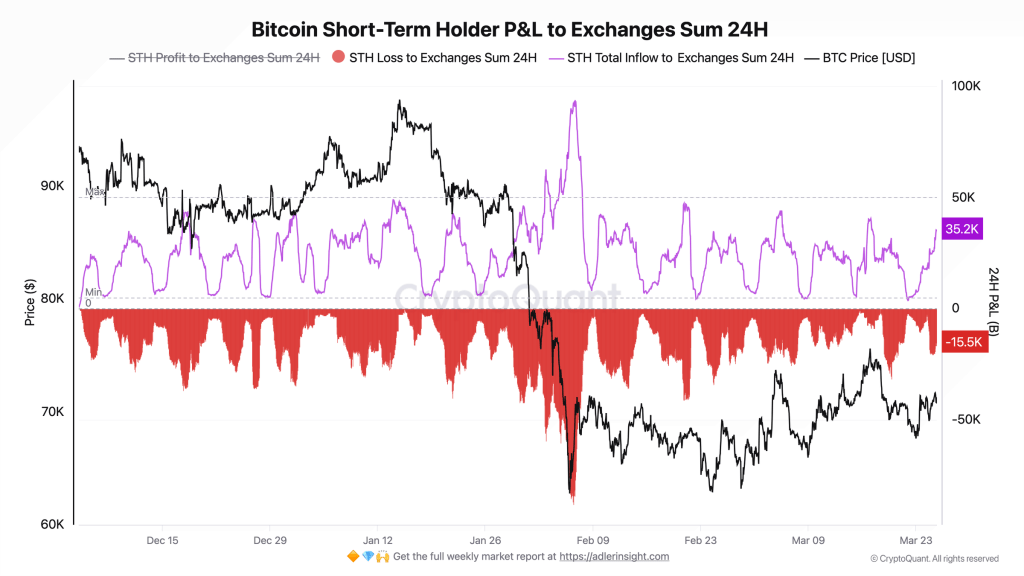 Bitcoin Short- Term Holder P&L to Exchanges Sum | Source: Axel Adler
Bitcoin STH Stress Eases But Whales Prevent Rally
That broader stress signal is partly offset by a separate observation from Darkfost, who argued that panic behavior among newer holders has eased meaningfully since the February flush.
He wrote: “When BTC fell below $60,000, a wave of panic emerged among the youngest investors (STHs), pushing them to send around 100,000 BTC (7-day sum) to Binance at the beginning of February. This behavior has evolved significantly, as these STH inflows to Binance have now been divided by four. Today, these inflows have reached their lowest recorded level, at around 25,000 BTC.”
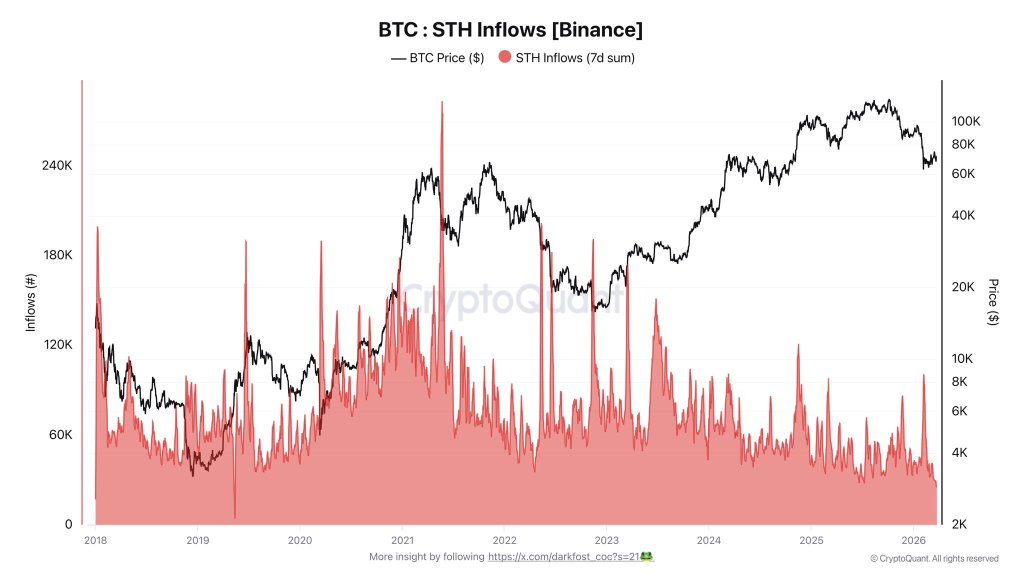 Bitcoin STH inflows Binance | Source: X @Darkfost_Coc
That does not contradict Adler’s thesis so much as refine it. Retail stress is still there across exchanges, but the most acute panic phase may be fading. Darkfost framed the shift as “a rather positive signal,” adding that the drop in Binance inflows represents “a real reduction in selling pressure” during what he called a difficult period for risk assets.
Even so, order-book data suggests Bitcoin is not yet out of the woods on the upside. CoinGlass flagged “heavy sell wall at 72.3k–72.6k” and called it “key resistance on any bounce.” It also pointed to near-term bids around $69,200, stronger support at $68,200 to $68,500, and deeper liquidity around $67,000 to $67,500.
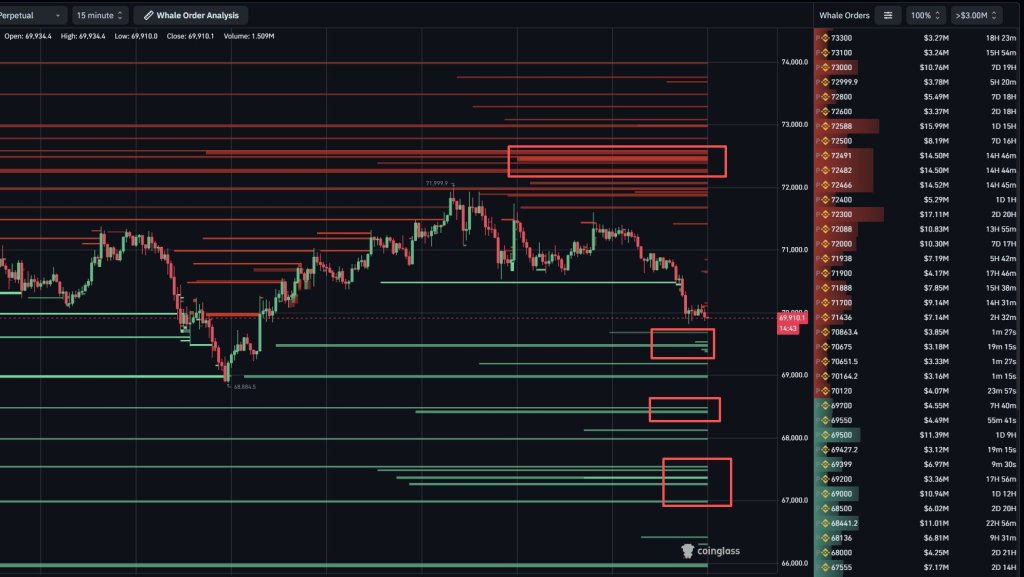 BTC whale orderbook | Source: X @coinglass_com
In CoinGlass’s words, “This is a classic setup of heavy overhead supply with layered bids below. Unless BTC reclaims the major sell wall overhead, short-term price action still looks more likely to sweep lower liquidity first before staging a stronger bounce.”
Taken together, the data points to a market where institutional accumulation is absorbing supply fast enough to steady price, but not yet force a decisive breakout. The constructive case is straightforward: ETF demand remains well above trend, panic selling among short-term holders continues to cool, and Bitcoin holds above $70,000.
The risk is just as clear. If ETF flows roll over and the market fails to clear the $72,300-$72,600 sell wall, the next move could still be a sweep into lower liquidity before any stronger recovery takes shape.
At press time, BTC traded at $69,573.
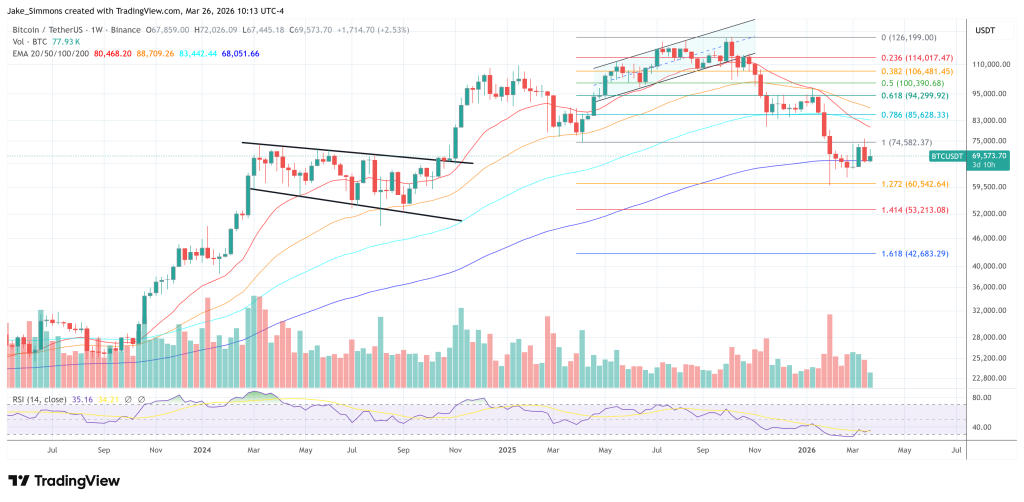 Bitcoin must break above $74,500, 1-week chart | Source: BTCUSDT on TradingView.com
Featured image created with DALL.E, chart from TradingView.com


 English (US) ·