
content, reviewed by leading industry experts and seasoned editors. Ad Disclosure
Bitcoin is trading at a critical juncture following a volatile week marked by sharp moves and heightened uncertainty. After reaching its all-time high of $112,000, BTC has entered a consolidation phase, hovering around key support and resistance levels. The market now watches closely for signs of the next decisive move—either a breakout to new highs or a deeper correction.
Despite the price cooling off, on-chain data suggests underlying strength in the market. According to CryptoQuant, Bitcoin’s average Netflow has shifted into negative territory since March 10, 2025. This metric tracks the balance between BTC deposits to exchanges (typically for selling) and withdrawals (often associated with accumulation). A consistent net negative flow indicates more Bitcoin is being withdrawn than deposited.
Currently, about 3,600 BTC are being withdrawn from exchanges daily by retail traders. This sustained trend is widely seen as a bullish signal, reflecting investor confidence and reduced selling pressure. It also implies that many market participants are choosing to hold rather than trade or liquidate at current prices. As Bitcoin stabilizes near critical levels, this persistent withdrawal trend could provide the fuel needed for the next leg up in the ongoing bull cycle.
Bitcoin Caught Between Uncertainty And Strength As Netflows Signal Accumulation
Bitcoin is currently navigating a phase of high uncertainty as it struggles to establish a clear direction. After peaking near $112,000, the price has entered a choppy consolidation, with bulls looking for a breakout above the all-time high and bears anticipating a sharp correction. The sentiment remains divided, fueled by growing volatility and rising macroeconomic risks.
One of the key external factors weighing on the crypto market is the bond market. Rising U.S. Treasury yields are heightening systemic pressure and affecting investor behavior across risk assets, including cryptocurrencies. As yields climb, the cost of capital increases, making speculative investments more sensitive to broader economic signals.
Yet amid the uncertainty, on-chain data continues to suggest strong underlying demand for Bitcoin. According to top analyst Axel Adler and insights from CryptoQuant, Bitcoin’s average Netflow has turned negative since March 10, 2025. This means that each day, approximately 3,600 more BTC are being withdrawn from exchanges than deposited, indicating sustained accumulation by retail investors and long-term holders.
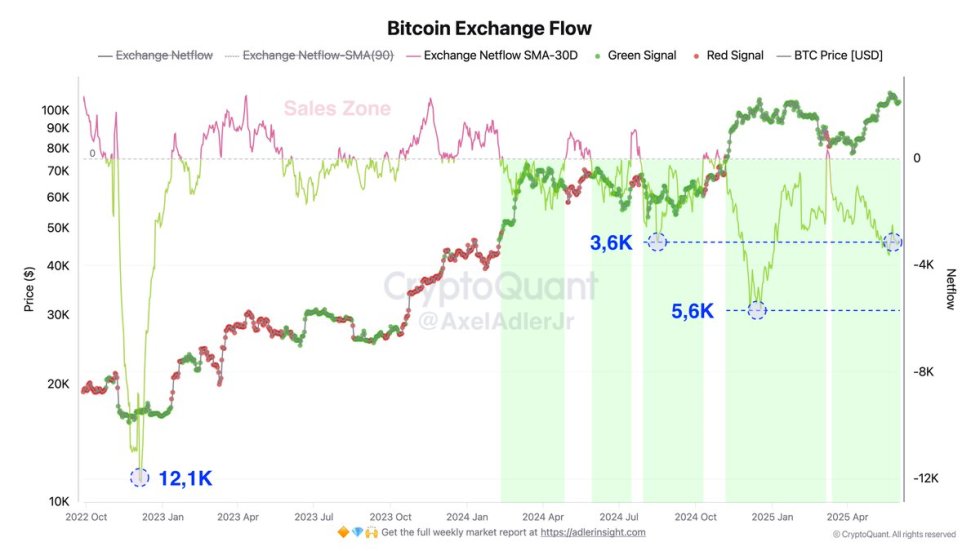 Bitcoin Exchange Flow | Source: Axel Adler on X
This trend, marked in green, stands in sharp contrast to the peak Netflow observed in December 2022, when over 12,100 BTC flowed into exchanges, signaling heavy sell pressure. Today’s negative flow points to a healthier market structure, where supply on exchanges steadily declines. While the price may lack short-term direction, this persistent withdrawal trend supports a bullish case over the medium term, as it reflects reduced selling pressure and long-term investor confidence.
BTC Price Holds Key Support As Bulls Attempt Recovery
Bitcoin is currently trading at $105,338, showing resilience after retesting the $103,600 support level. This area has held firmly despite recent volatility and remains a critical demand zone for bulls to defend. The chart shows BTC bouncing off the 200-period SMA (red line), with a mild uptrend forming on the 4-hour timeframe. Price is now attempting to reclaim the 34 EMA ($105,554) and challenge the 50 and 100 SMAs, both of which converge near $106,900 and act as dynamic resistance.
 BTC holding above key moving average | Source: BTCUSDT chart on TradingView
The recent lower high around $109,300 remains a significant barrier for bullish continuation. A decisive breakout above this level would likely signal a fresh attempt at the all-time high near $112,000. On the downside, losing the $103,600 mark would open the door for a deeper correction, potentially dragging BTC back toward the $100,000 psychological level.
Volume has been relatively muted during the latest bounce, which suggests the move may lack conviction unless accompanied by a spike in buying pressure. For now, Bitcoin remains range-bound between $103,600 and $109,300, with bulls needing to sustain higher lows and reclaim short-term moving averages to regain momentum. The coming days will be pivotal in determining whether BTC resumes its uptrend or enters a broader consolidation phase.
Featured image from Dall-E, chart from TradingView
Editorial Process for bitcoinist is centered on delivering thoroughly researched, accurate, and unbiased content. We uphold strict sourcing standards, and each page undergoes diligent review by our team of top technology experts and seasoned editors. This process ensures the integrity, relevance, and value of our content for our readers.


 English (US) ·