Bitcoin may face a short-term dip as a bearish divergence, CME gap, and a high IBCI reading point to downside below $115,000.

Key takeaways:
A hidden bearish divergence on the RSI hints at weakening bullish momentum for Bitcoin.
A CME gap between $114,000–$115,000 could act as a magnet.
Market cyclicality and an assortment of indicators show Bitcoin in a distribution zone.
Bitcoin (BTC) is showing signs of potential weakness, with three critical charts suggesting the possibility of new weekly lows in July. While the long-term trend remains intact, traders should brace for short-term volatility.
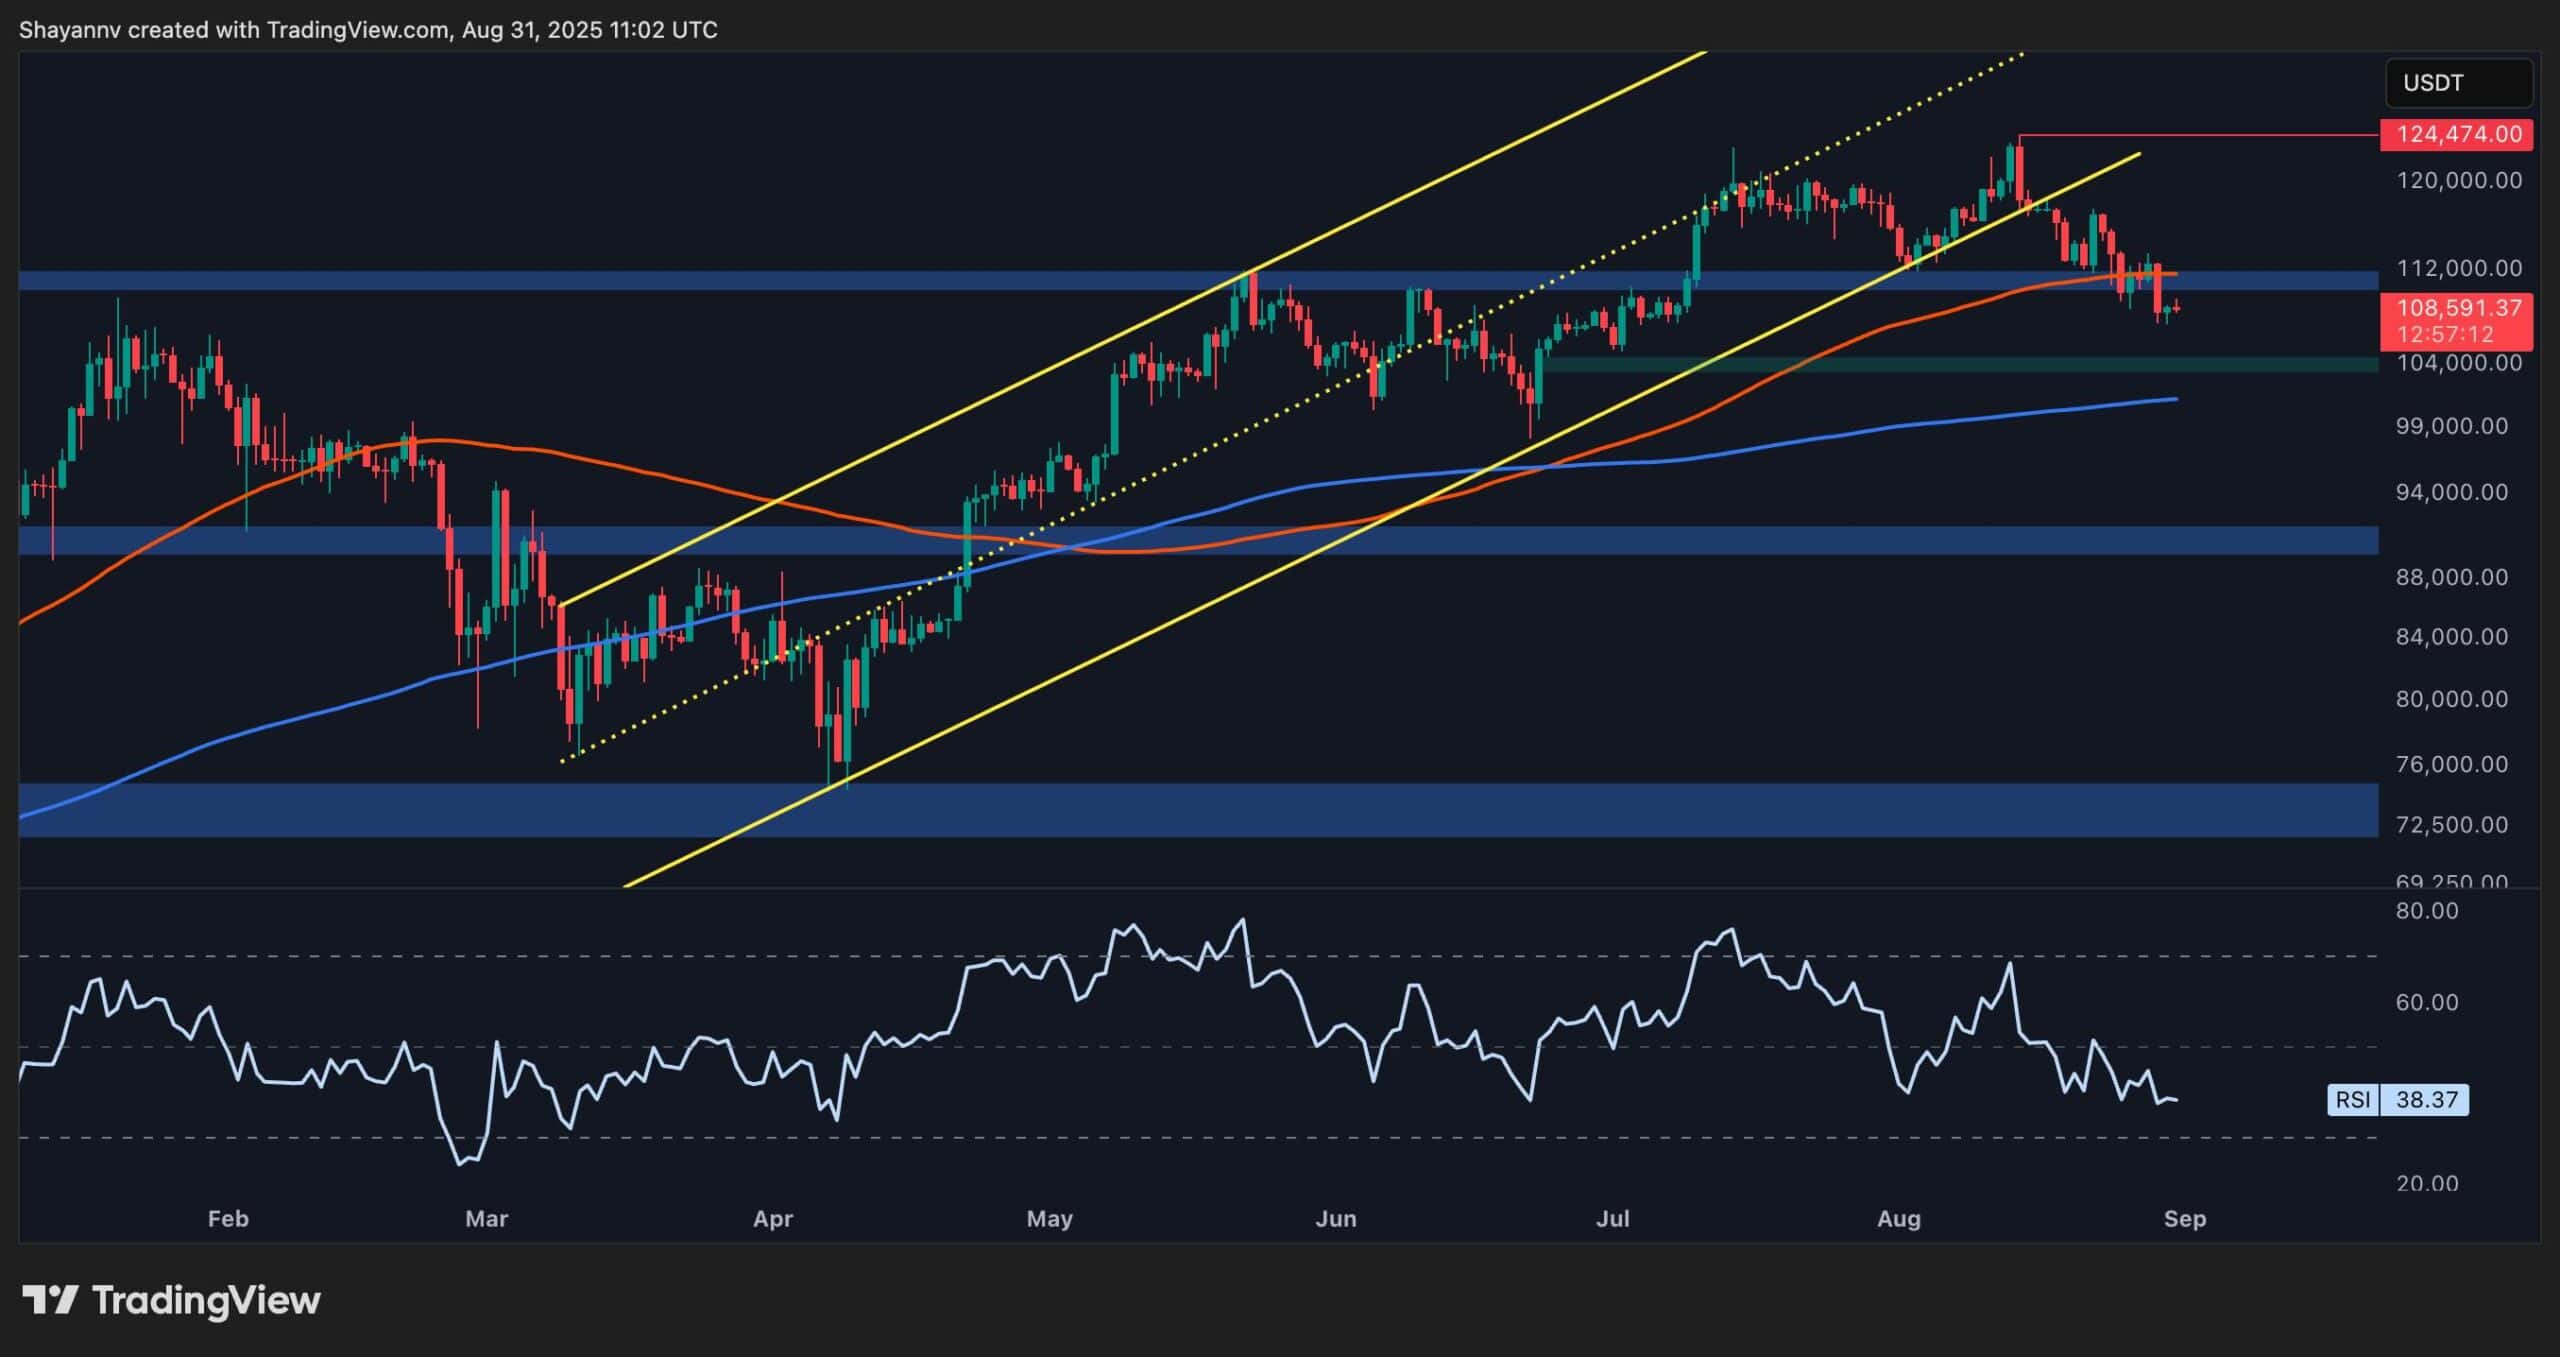
Bitcoin currently exhibits a hidden bearish divergence between its price and the relative strength index (RSI), a momentum indicator that measures the strength of price movements.
A hidden bearish divergence occurs when the price makes higher highs, but the RSI forms equal or lower highs. This divergence hints at weakening momentum behind the rally, often leading to downside corrections.
 Bearish divergence comparison between 2024 and 2025. Source: Cointelegraph/TradingView
This same pattern appeared in March 2024, after which Bitcoin saw a 20% price drop in the following days. Likewise, the ongoing divergence may lead to another corrective move, potentially pushing Bitcoin to fresh short-term lows.
BTC CME gap looms as a downside magnet
A CME gap exists between $114,380 and $115,635 on the daily chart. CME gaps form when Bitcoin trades outside regular hours on the Chicago Mercantile Exchange (CME), leaving price voids that are often filled in active trading sessions.
 Bitcoin CME futures gap. Source: Cointelegraph/TradingView
These gaps matter because historical data show that Bitcoin tends to “fill” them, i.e., the price retraces to cover the untraded range. In 2025, seven out of nine CME gaps have already been filled, with only this one and a smaller gap between $91,970 and $92,450 still open.
The high fill rate underscores Bitcoin’s chances to revisit these levels, leading to a short-term dip to close the $114,000 bracket.
Related: Traditional companies enter the crypto treasury game with BTC, XRP and SOL buys
Bitcoin is in a distribution zone
Anonymous crypto analyst Gaah noted the Index Bitcoin Cycle Indicators (IBCI) has entered the distribution zone, a region historically linked with market euphoria and interim tops. This is the third such entry in the current bull cycle.
 Index Bitcoin Cycle Indicator chart. Source: CryptoQuant
The analyst explained that while the index touched only the lower base of the zone (80%), not the peak (100%) seen in past cycle tops, the reading still serves as a warning signal. Key indicators like the Puell Multiple and STH-SOPR (Short-Term Holder Spent Output Profit Ratio) remain below mid-levels, suggesting that retail speculation and aggressive profit-taking from miners haven’t peaked yet. Gaah added,
“The behavior of the IBCI therefore offers an important warning sign: we are in a zone of high corrective risk in the short term, but not necessarily at a major end-of-cycle top.”Related: Bitcoin due 'massive short squeeze' as BTC dominance bounces to 62%
This article does not contain investment advice or recommendations. Every investment and trading move involves risk, and readers should conduct their own research when making a decision.


 English (US) ·