 1 month ago
21
1 month ago
21
As Bitcoin (BTC) attempts to reclaim a key resistance area, an analyst has suggested that the end of BTC’s two-month consolidation could be weeks away, potentially opening “generational opportunities” before the next bull run.
Bitcoin Consolidation’s End May Be Weeks Away
On Monday, Bitcoin jumped 5% from Sunday’s lows to a key area for the first time in April. Notably, the flagship cryptocurrency has been trading between $62,000-$74,000 over the past two months but has not reached the upper end of its range since late March.
Now, BTC is retesting the $69,000-$70,000 resistance area, which could set the stage for a crucial short-term move. Market observer Ted Pillows stated that if the cryptocurrency reclaims this zone, a rally towards $72,000-$74,000 could happen.
On the contrary, a rejection would likely see Bitcoin drop to the $65,000-$66,000 support zone, where price has held over the past month. In an X analysis, Ali Martinez noted that the UTXO Realized Price Distribution (URPD) shows the flagship cryptocurrency is “stuck in a ‘No-Trade Zone.’”
Per the post, “the URPD shows exactly where every BTC last moved,” with a massive cluster of holders between $70,685-$63,111. “As long as we trade here, millions of holders are incentivized to defend their ‘buy-in,’ creating a natural floor,” he added.
Nonetheless, analyst Max Crypto affirmed that BTC’s “decision time is very close,” suggesting that it could see its next big move unfold in the upcoming weeks, based on its previous price action.
 BTC’s current price action resembles previous consolidation performances. Source: Max Crypto on X
As he explained, the leading crypto has shown the same performance over the past year, consolidating for 8-15 weeks before the last four big moves. This time, Bitcoin has been moving sideways for 8 weeks, entering its 9th consolidation week on Monday.
Based on its previous performance, the market watcher considers that “BTC’s next big move will most likely happen by mid-April, irrespective of US-Iran talks, and will probably be to the downside.”
Where Is BTC’s Final Support Located?
In his X post, Martinez also analyzed multiple patterns and on-chain metrics to map out BTC’s high-probability accumulation zones and potential bottom.
Notably, he highlighted that Bitcoin is approaching its most significant support floor since 2017: an ascending trendline that has guarded its price for nine years, and every retest has preceded a parabolic expansion.
This trendline currently sits around the $60,000 and $56,000 levels and could be “the potential launchpad for the next major bull cycle” if it holds.
In addition, he outlined three metrics that could mark the “line in the sand” and the best buying opportunities for BTC: the Cumulative Value Days Destroyed (CVDD), the MVRV pricing bands, and the Long-Term Holder (LTH) Realized Price.
The CVDD, which “tracks when ‘Old Hands’ pass BTC to new buyers, creating a structural foundation for the entire market,” is currently around $47,960. Meanwhile, the MVRV 0.8 Band, located around $43,647, has historically marked the bottom and “the exact zone where BTC sellers exhaust themselves and the ‘Strong Hands’ take over the supply.”
Lastly, Martinez noted that the LTH Realized Price, currently at $49,387, is often the final support. However, he added that if the price dips below this level, “it signals a final capitulation phase, especially if the -0.2 Std Dev band at $36,657 is hit” at what he deemed “Generational Buy” levels.
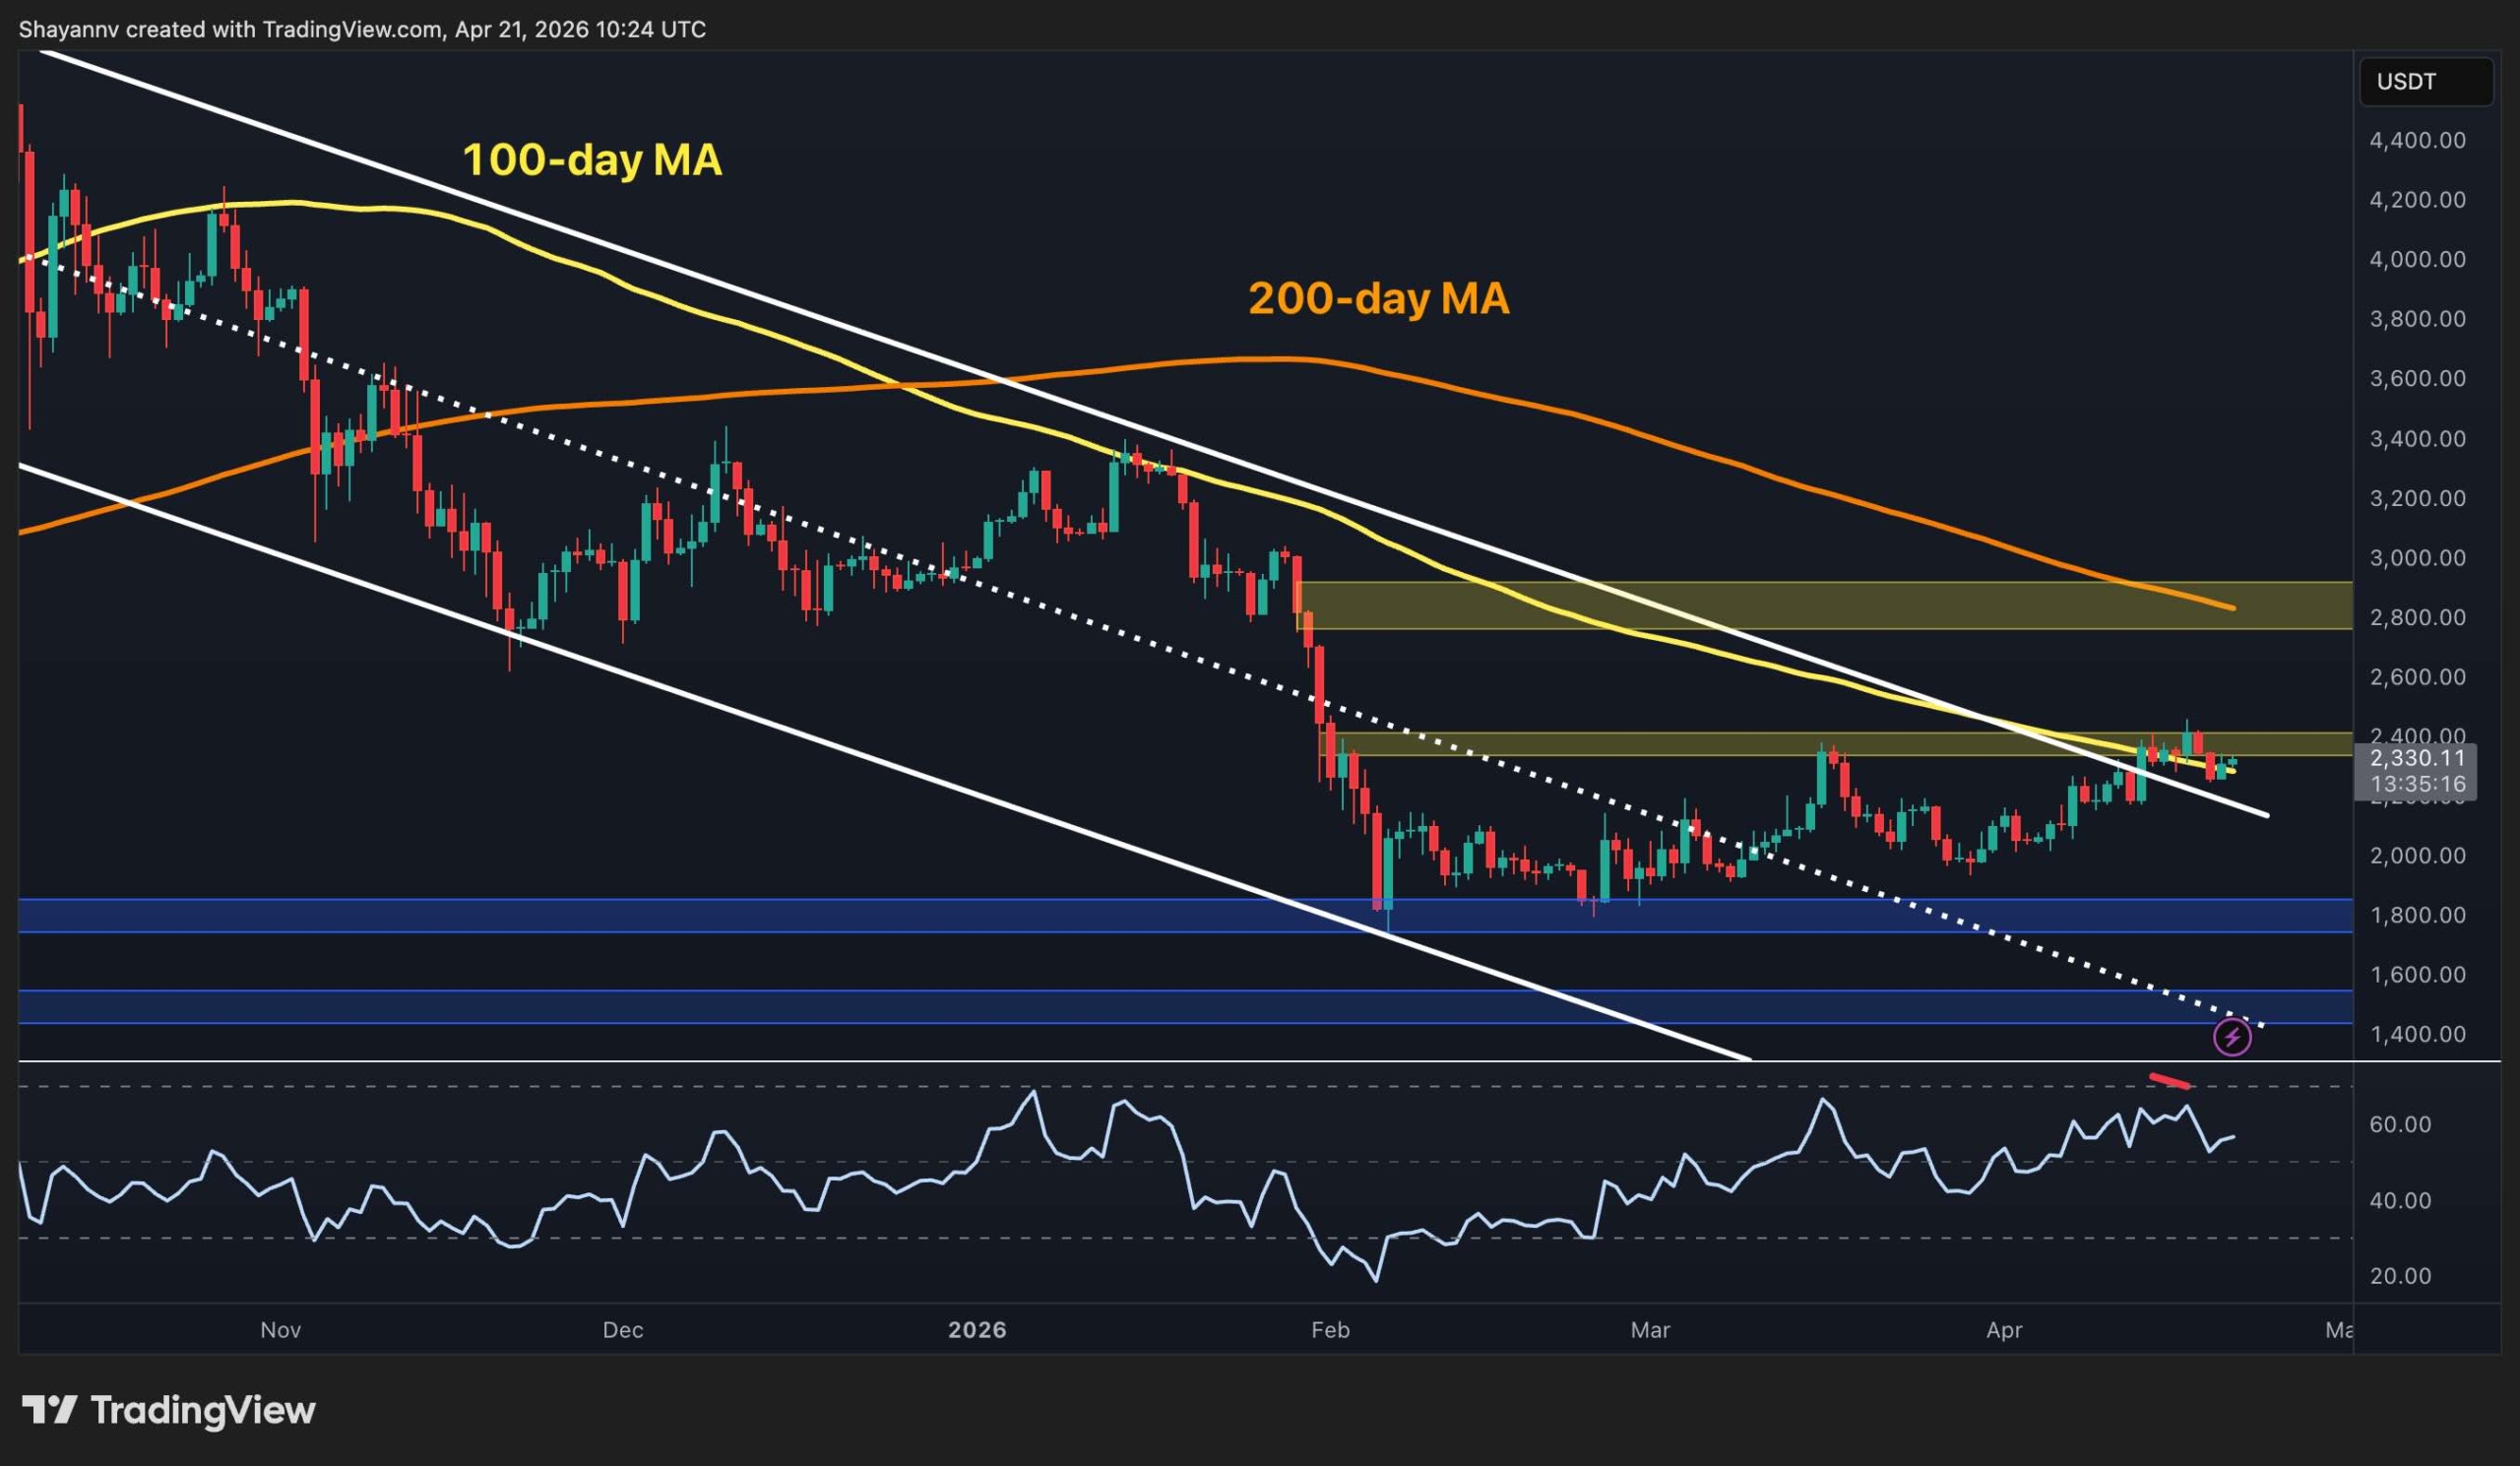
 Bitcoin trades at $69,350 in the one-week chart. Source: BTCUSDT on Tradingview
Featured Image from Unsplash.com, Chart from TradingView.com


 English (US) ·