 4 weeks ago
11
4 weeks ago
11
Bitcoin has entered a corrective phase after tagging the $111K region, following a strong multi-week rally. While momentum has cooled, the broader structure remains intact.
The price action is showing signs of potential accumulation at support, and traders are watching closely to see if this pullback turns into a deeper correction or a fresh leg up.
Technical Analysis
By ShayanMarkets
The Daily Chart
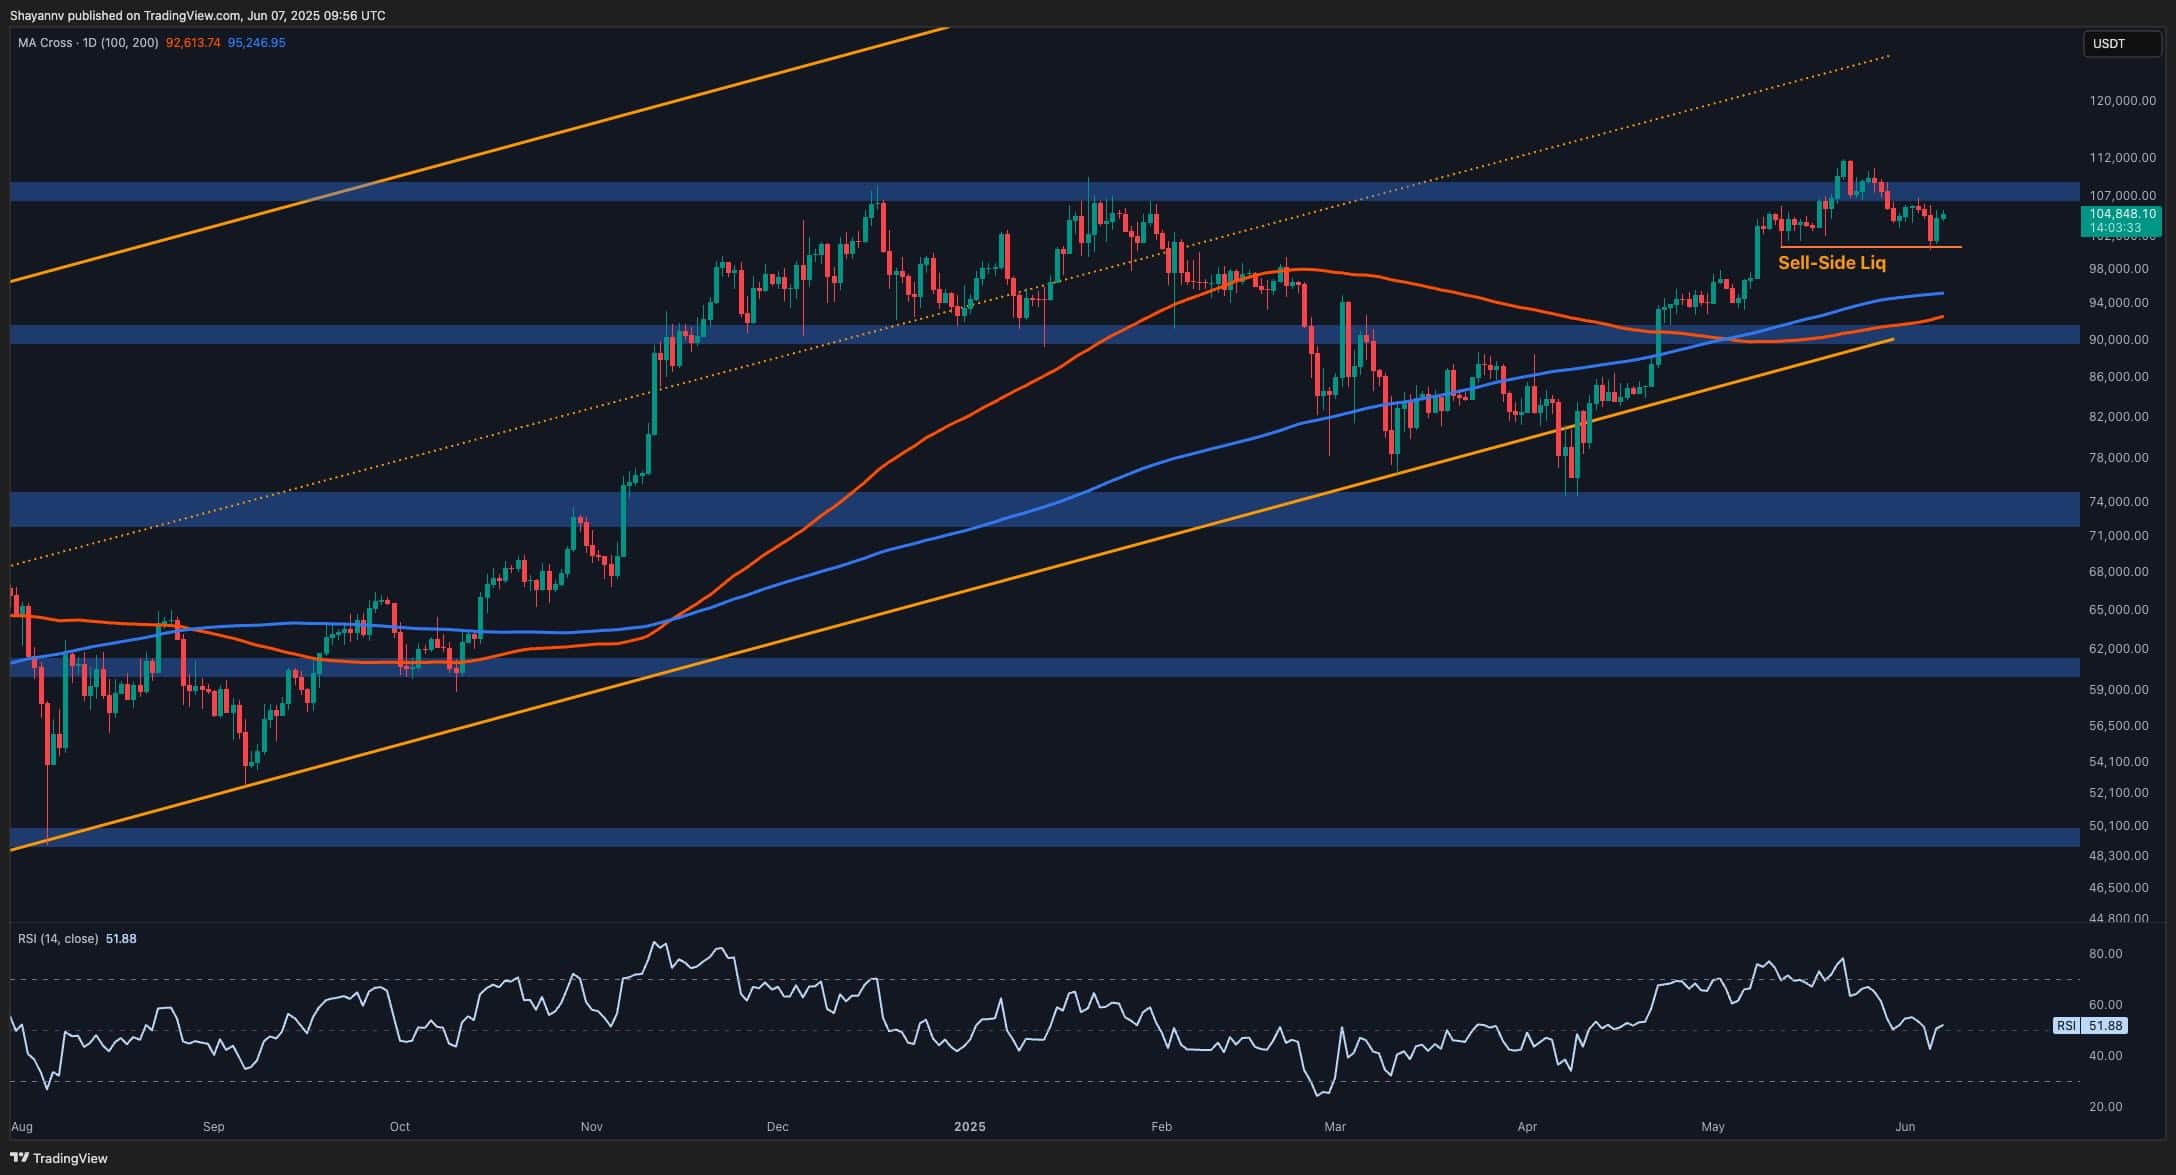
On the daily timeframe, BTC is currently holding above the $103K region after sweeping the $101K sell-side liquidity. The previous bullish structure is still valid, and the price is likely targeting the mid-range of the ascending channel. The 100-day (orange) and 200-day (blue) moving averages are not far below, sitting at $92K and $95K, respectively, and continue to slope upward. This indicates that the long-term bullish momentum is not yet broken.
The RSI on the daily is recovering slightly from below 50, suggesting neutral momentum after days of cooling off. Until the asset breaks below the $100K–$101K range, the current drop looks like a healthy correction in an uptrend. However, failure to reclaim the $106K–$108K resistance area quickly could increase the probability of revisiting the $95K–$97K order block, and even the two moving averages.
The 4-Hour Chart
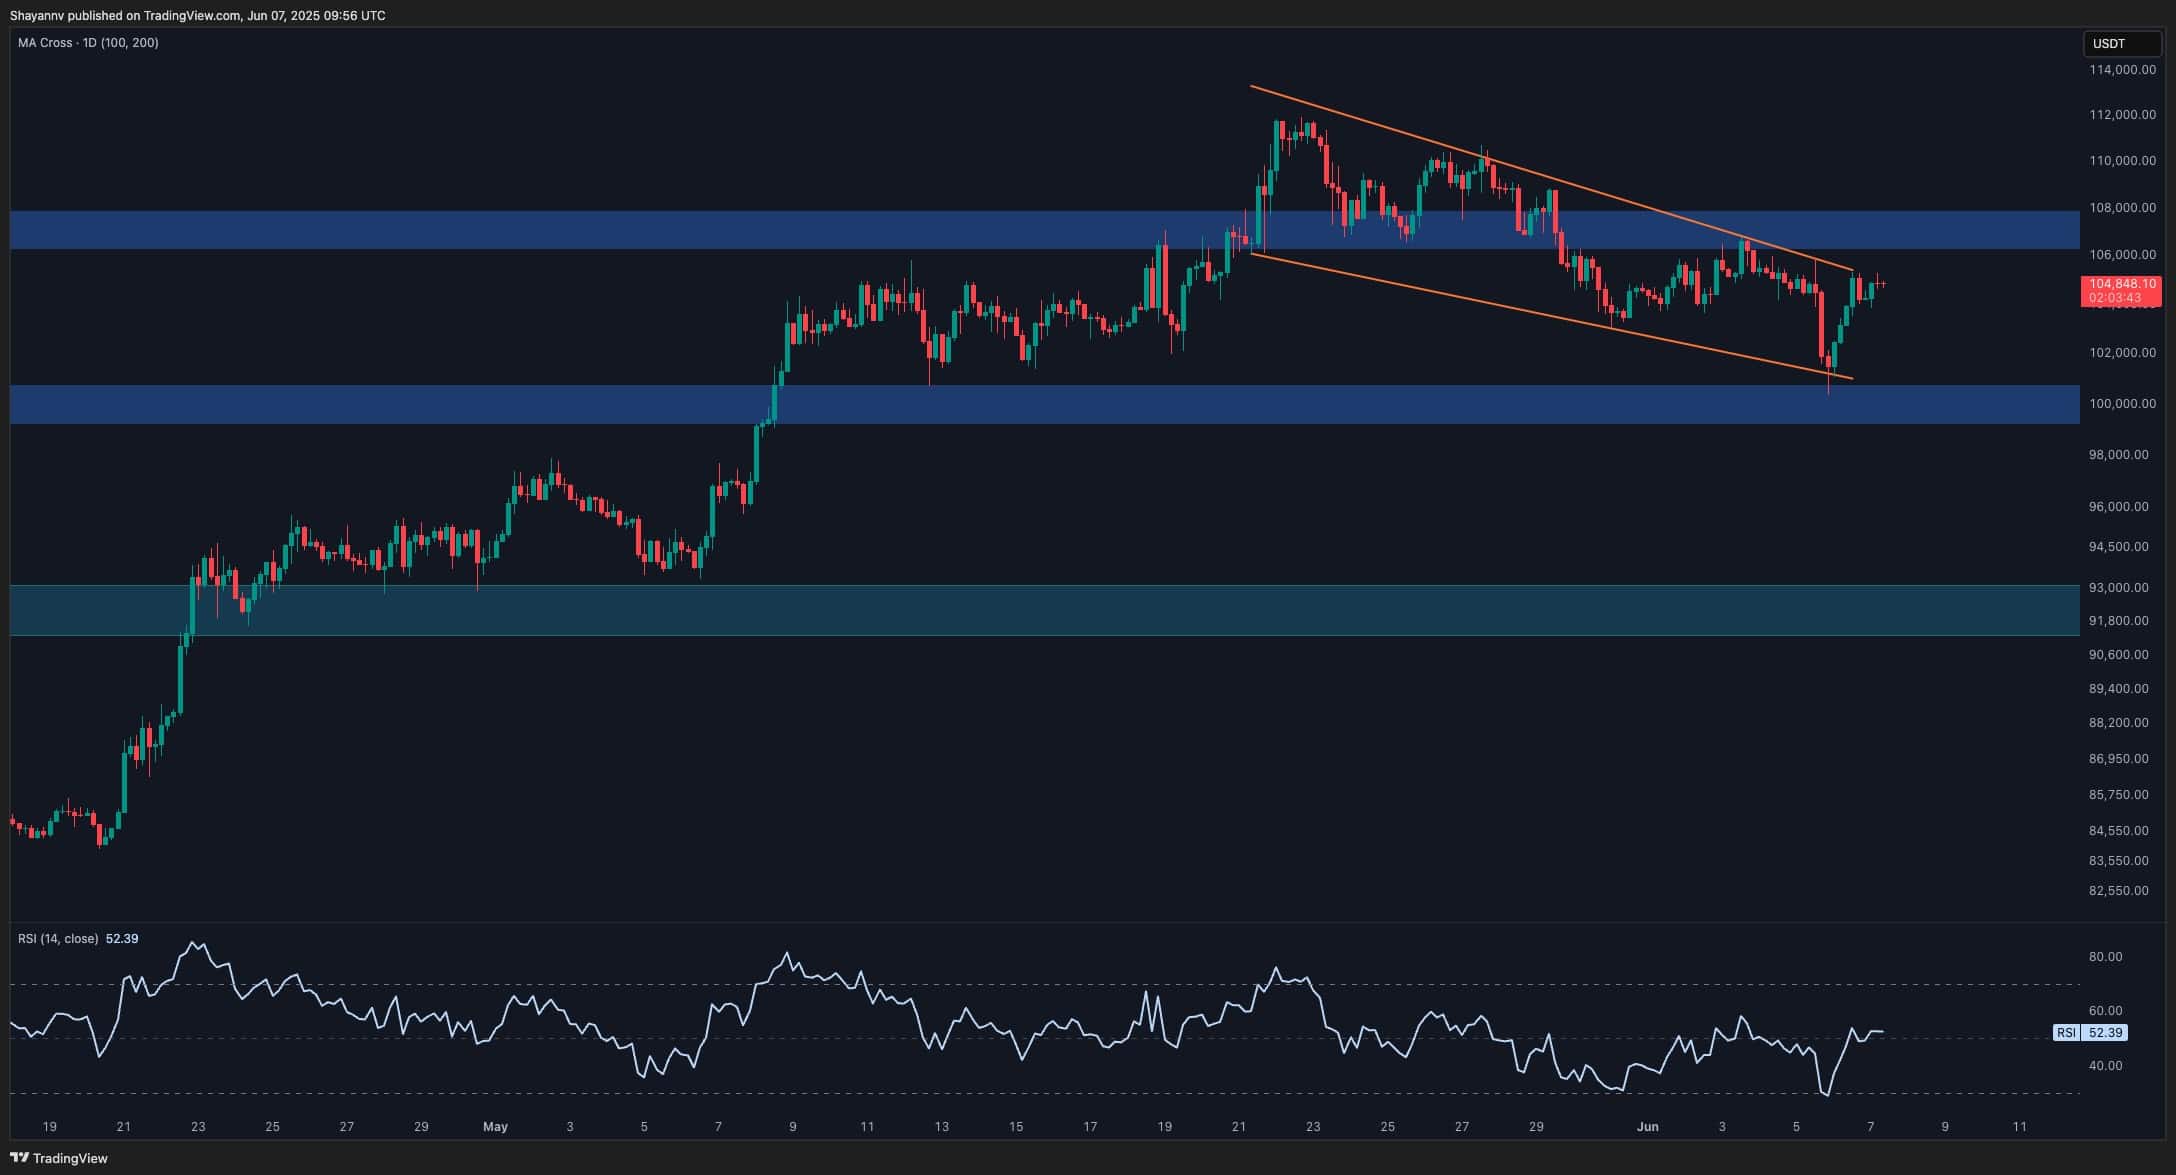
Zooming into the 4H chart, BTC wicked below the descending wedge pattern after finding strong demand near the $100K area and began a V-shaped recovery. This structure historically signals a bullish reversal, and the move back above $103K supports this case.
However, the current rally is approaching resistance again, which is the higher boundary of the pattern near the $105K mark, and the RSI is still under 50. This level could act as a temporary ceiling unless momentum strengthens.
The sharp wick below $100K looks like a textbook liquidity grab, suggesting market makers ran stops before driving the price higher. If the buyers manage to hold above the $100K base and flip the $105K–$106K area, the door reopens for a push toward $108K and possibly a new all-time high above $112K. On the other hand, a failure to do so would likely lead to more range-bound action between $101K and $106K in the coming days.
On-Chain Analysis
Exchange Reserve
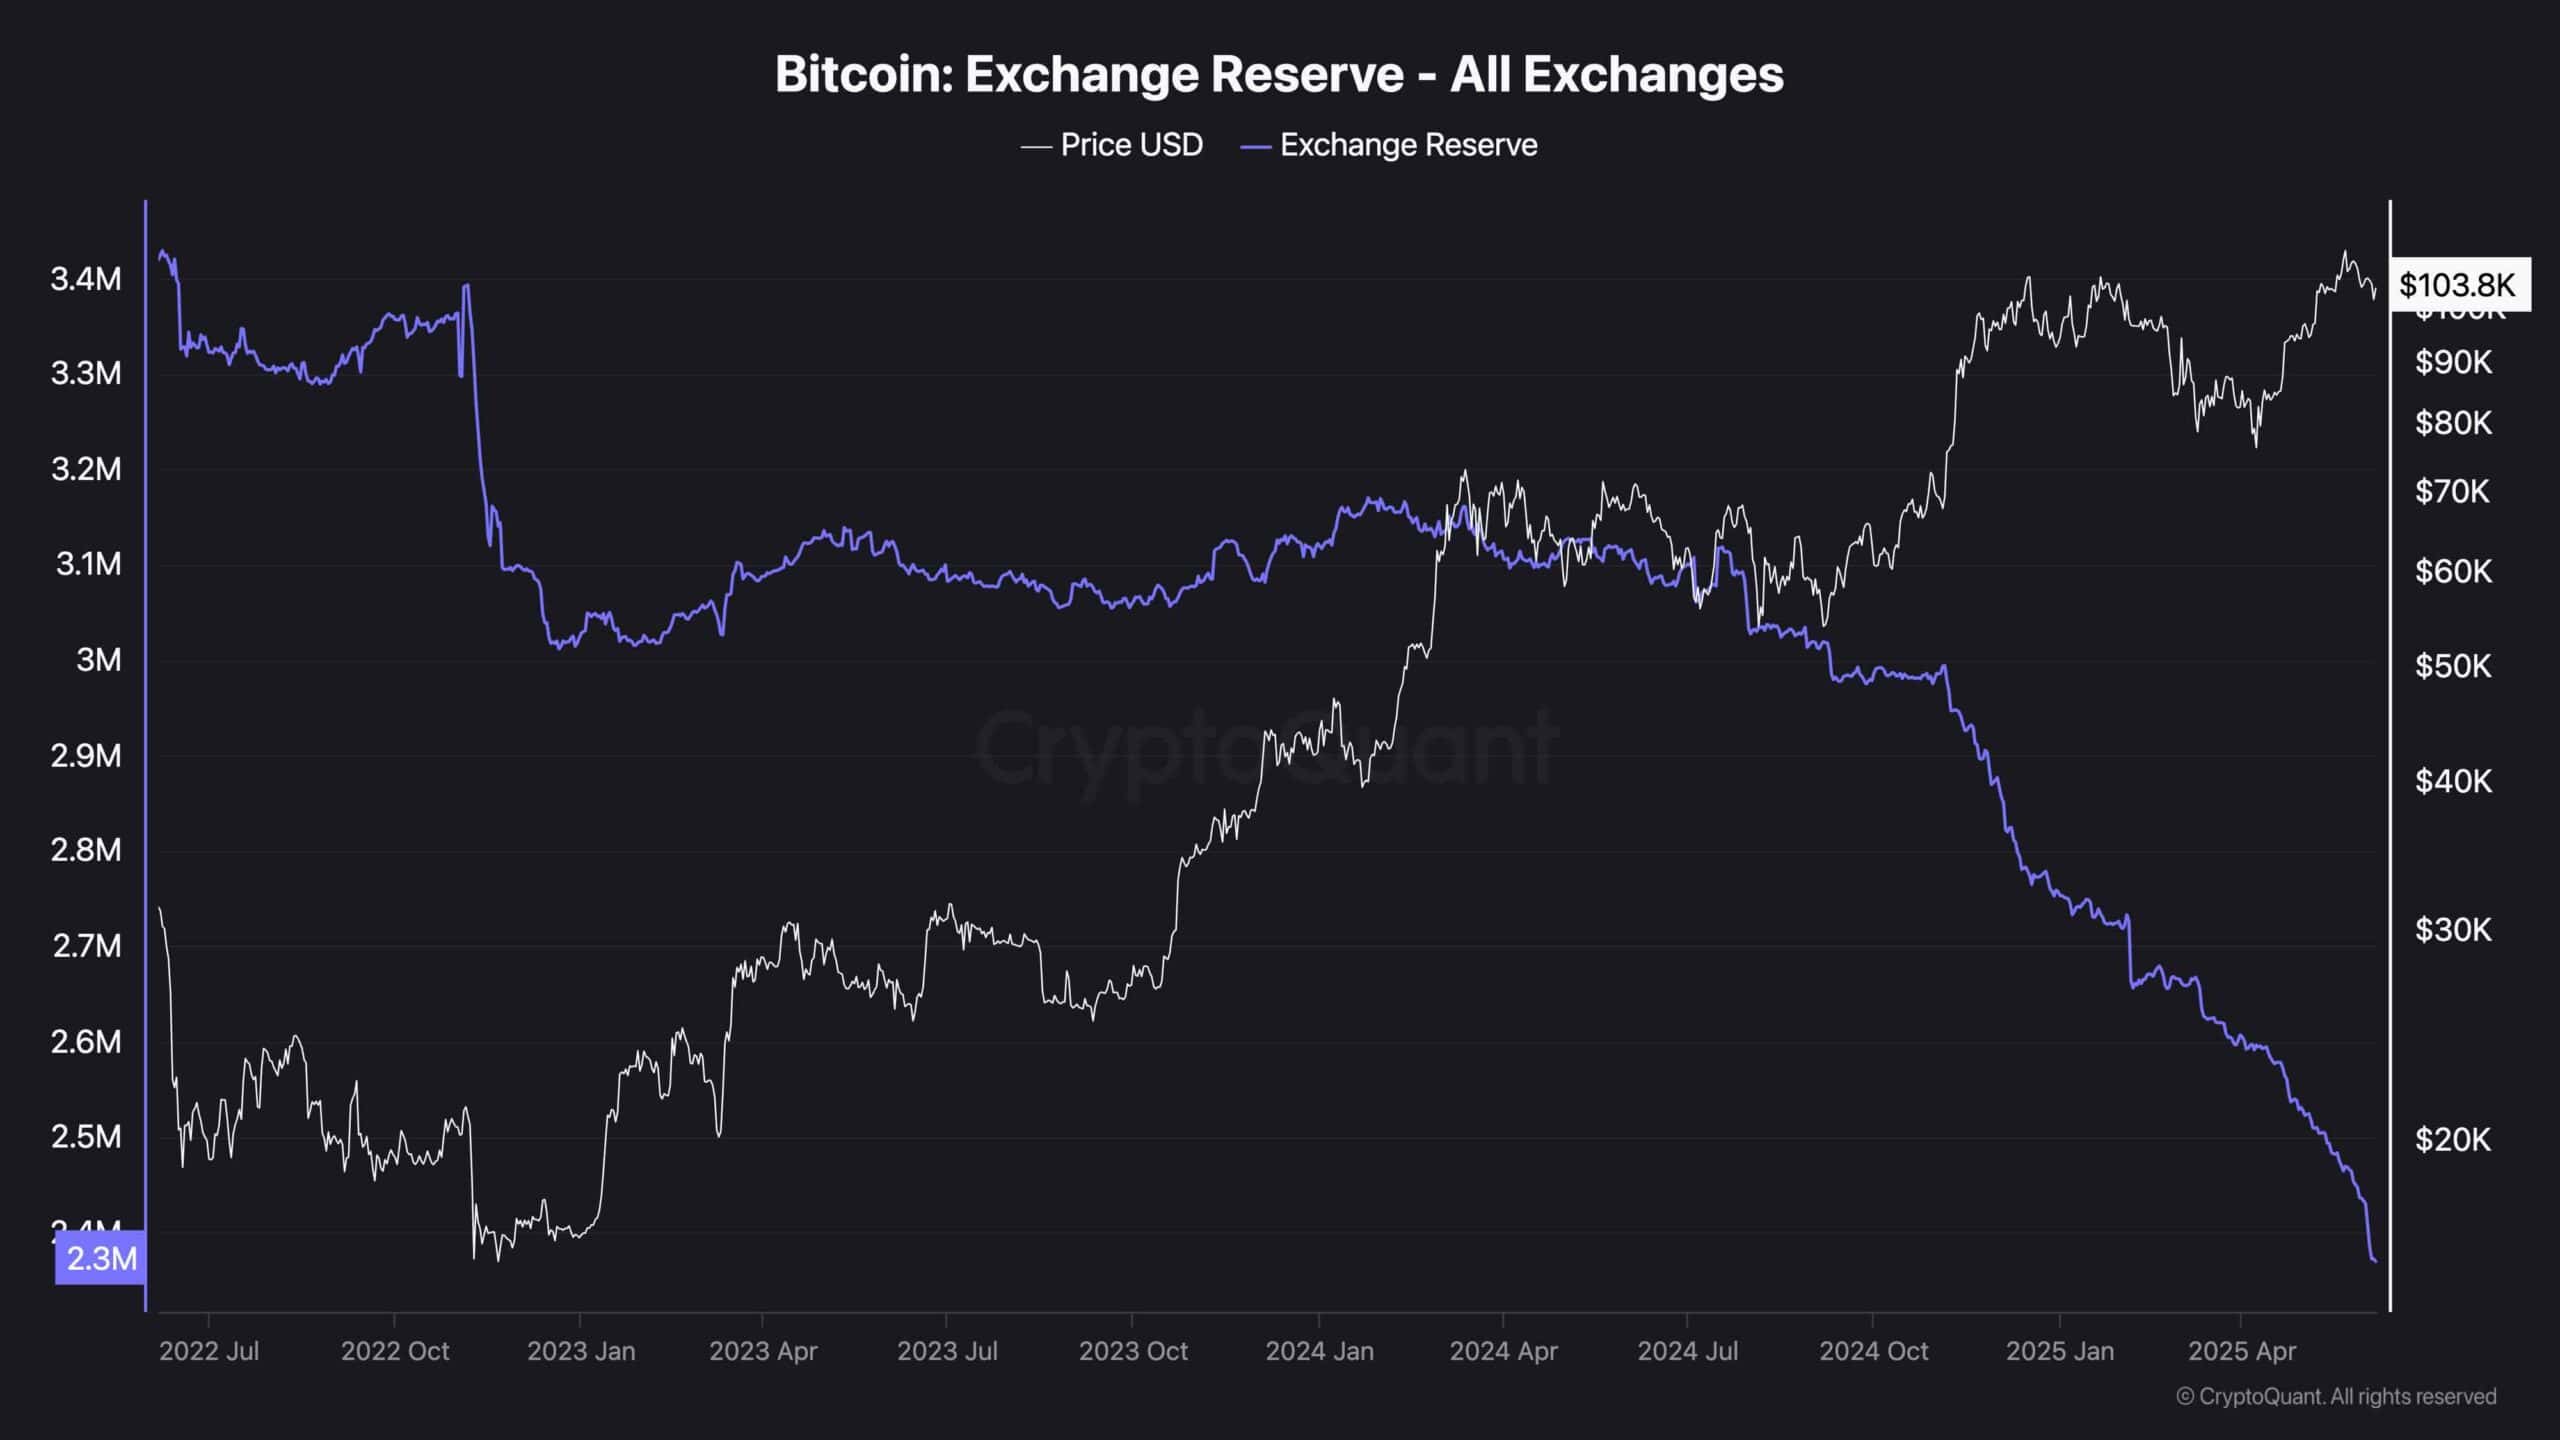
The Exchange Reserve chart reveals a persistent and steep decline in the amount of Bitcoin held on centralized exchanges, now reaching a historic low at 2.3 million BTC. This trend has accelerated over the past year and continues into June 2025, despite BTC trading above $100K. In classical supply-demand terms, this represents a significant supply-side squeeze: fewer coins on exchanges mean less liquidity available for instant sale, tightening the circulating supply and amplifying the impact of even moderate demand spikes.
This behaviour reflects a strong macroeconomic undercurrent. First, institutional accumulation is likely driving much of this trend. Large entities often move coins off exchanges into custody solutions when positioning for long-term holding or to reduce counterparty risk. Second, the growing presence of spot Bitcoin ETFs and custodial platforms (like Fidelity or BlackRock) means that BTC is increasingly flowing into vehicles that don’t recycle it back onto exchanges, removing it from the liquid supply indefinitely. This dynamic creates structural illiquidity that underpins Bitcoin’s asymmetric upside.
Binance Free $600 (CryptoPotato Exclusive): Use this link to register a new account and receive $600 exclusive welcome offer on Binance (full details).
LIMITED OFFER for CryptoPotato readers at Bybit: Use this link to register and open a $500 FREE position on any coin!
Disclaimer: Information found on CryptoPotato is those of writers quoted. It does not represent the opinions of CryptoPotato on whether to buy, sell, or hold any investments. You are advised to conduct your own research before making any investment decisions. Use provided information at your own risk. See Disclaimer for more information.
Cryptocurrency charts by TradingView.


![11 Best Crypto & Bitcoin Casinos in Australia [2025]](https://coincheckup.com/blog/wp-content/uploads/best-crypto-and-bitcoin-casinos-in-australia-coincheckup-1024x576.png)

 English (US) ·