
content, reviewed by leading industry experts and seasoned editors. Ad Disclosure
The recent Bitcoin price move seems to be going according to plan in an analysis shared by crypto analyst TehThomas. The post, which was shared on the TradingView website, showed a possible path that the Bitcoin price could follow this period, showing both bounce-off and resistance points. Now, with Bitcoin already clearing $117,000, it seems that the next phase of the analysis could be playing out from here, and the crypto analyst is quite bullish.
What Happens After The Bitcoin Price Touched $117,000?
In the analysis, Thomas pointed out that the Bitcoin price had successfully cleared out local highs and was able to take out the liquidity above the previous range. However, there were inefficiencies that had been left behind after the previous move that were inadvertently filled by a temporary fakeout.
After the market correction that saw the Bitcoin price move toward $112,000, there is now a clearer structure forming. Right now, the Bitcoin price is moving toward the demand zones on the higher timeframes, and this could push the price higher.
The analysis points out that the correction from the liquidity sweep pushed the Bitcoin price to test key imbalances, with a bullish shift happening since then. Also, there is an inverted daily gap that has already been tested several times at around $114,000, and with this level holding, it shows that there is a lot of support here.
Another thing that the liquidity sweep has shown is that the buy-side pressure has now been cleared. This has led to a reset of the market, and from here, any moves in any direction will be more purposeful. But the price rising higher from here looks to be the most likely path.
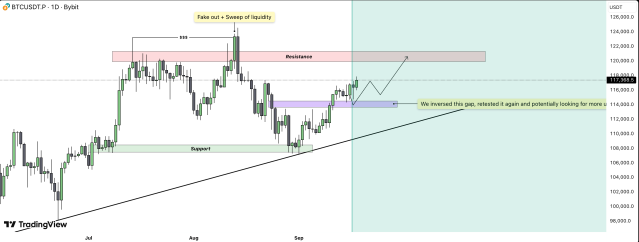 Source: TradingView
How High Can BTC Go?
If the structure outlined by the crypto analyst holds, then the Bitcoin price could see another small correction from its current local peaks. Once this is done, the next step is the creation of the balance that would help to drive the digital asset’s price higher.
The analyst explains that if the Bitcoin price holds up the inverted daily gap, then the next target would put it above the $120,000 level, where the next resistance zone lies. However, a loss of this inverted gap and subsequent trendline support would be very bearish for the price. This would trigger another correction back toward the $111,000-$112,000 territory.
“Bitcoin has absorbed liquidity, filled inefficiencies, and inverted a daily gap that is now holding as support,” Thomas explained. “Combined with the ongoing daily uptrend, this strengthens the bullish outlook with a clear target toward the 120,000 USDT resistance zone.”
Featured image from Dall.E, chart from TradingView.com
Editorial Process for bitcoinist is centered on delivering thoroughly researched, accurate, and unbiased content. We uphold strict sourcing standards, and each page undergoes diligent review by our team of top technology experts and seasoned editors. This process ensures the integrity, relevance, and value of our content for our readers.


 English (US) ·