Bitcoin price has fallen below $61,000 on June 10 as traders cut risk exposure ahead of the latest U.S. inflation report, extending a selloff that has already pushed the crypto asset more than 50% below its October 2025 record high.
Summary
- Bitcoin price fell below $61,000 ahead of the U.S. CPI report as traders reduced risk exposure amid inflation and Federal Reserve uncertainty.
- Elevated oil prices and escalating Middle East tensions added to inflation concerns, keeping pressure on risk assets.
- Technical indicators remain bearish, with analysts watching the $60,000 support level and $55,000-$50,000 as the next major support zone.
According to data from crypto.news, Bitcoin (BTC) price dropped to an intraday low of $60,755 before recovering slightly to trade near $61,200 at the time of writing. The decline came hours before the release of U.S. Consumer Price Index data, a report investors are closely watching after a series of stronger-than-expected economic indicators prompted markets to scale back expectations for Federal Reserve easing.
Futures markets have increasingly moved toward a higher-for-longer interest-rate outlook in recent weeks. Earlier economic releases, including labor market data that exceeded forecasts, encouraged traders to price in the possibility of rate hikes later this year rather than additional rate cuts, creating pressure across risk assets, including cryptocurrencies.
Inflation concerns and geopolitical risks weigh on sentiment
Adding to investor caution, oil prices remained elevated despite a sharp pullback on Tuesday. Crude oil traded around $88 per barrel on Wednesday as traders monitored growing tensions in the Middle East.
According to reports, Iran launched attacks on Bahrain, Jordan, and Kuwait after the United States carried out what it described as self-defense strikes following the downing of an American helicopter.
Energy markets have become a key focus because sustained strength in crude prices can complicate the inflation outlook. With CPI data due later in the day, traders appeared reluctant to increase exposure to volatile assets while uncertainty around both inflation and geopolitics remained high.
Institutional flows have also provided little support. Data from SoSoValue shows U.S. spot Bitcoin exchange-traded funds have experienced persistent capital withdrawals in recent weeks, removing billions of dollars from the sector and reducing a major source of demand that helped fuel previous rallies.
Weak demand conditions have also drawn attention from market participants. As previously reported by crypto.news, trading firm Wintermute said the lack of meaningful capital inflows continues to complicate efforts to identify a sustainable market bottom. According to the firm’s analysis, current buying activity remains insufficient to absorb persistent selling pressure across the market.
Wintermute also highlighted a notable liquidity gap between $50,000 and $59,000 on Bitcoin’s volume profile. The firm warned that if nearby support levels fail, the absence of significant trading activity within that range could increase the risk of a sharper move lower as sellers search for the next major area of demand.
At the same time, broader market sentiment has weakened as investors continue rotating away from speculative assets. Major equity benchmarks have also faced pressure amid rising Treasury yields and changing expectations for monetary policy.
Technical indicators point to critical support levels
Chart signals suggest Bitcoin entered the CPI event in a technically fragile position. On the daily timeframe, the cryptocurrency remains below a bearish Supertrend indicator, which currently sits near $68,400. The indicator flipped negative in late May and has yet to show signs of a reversal.
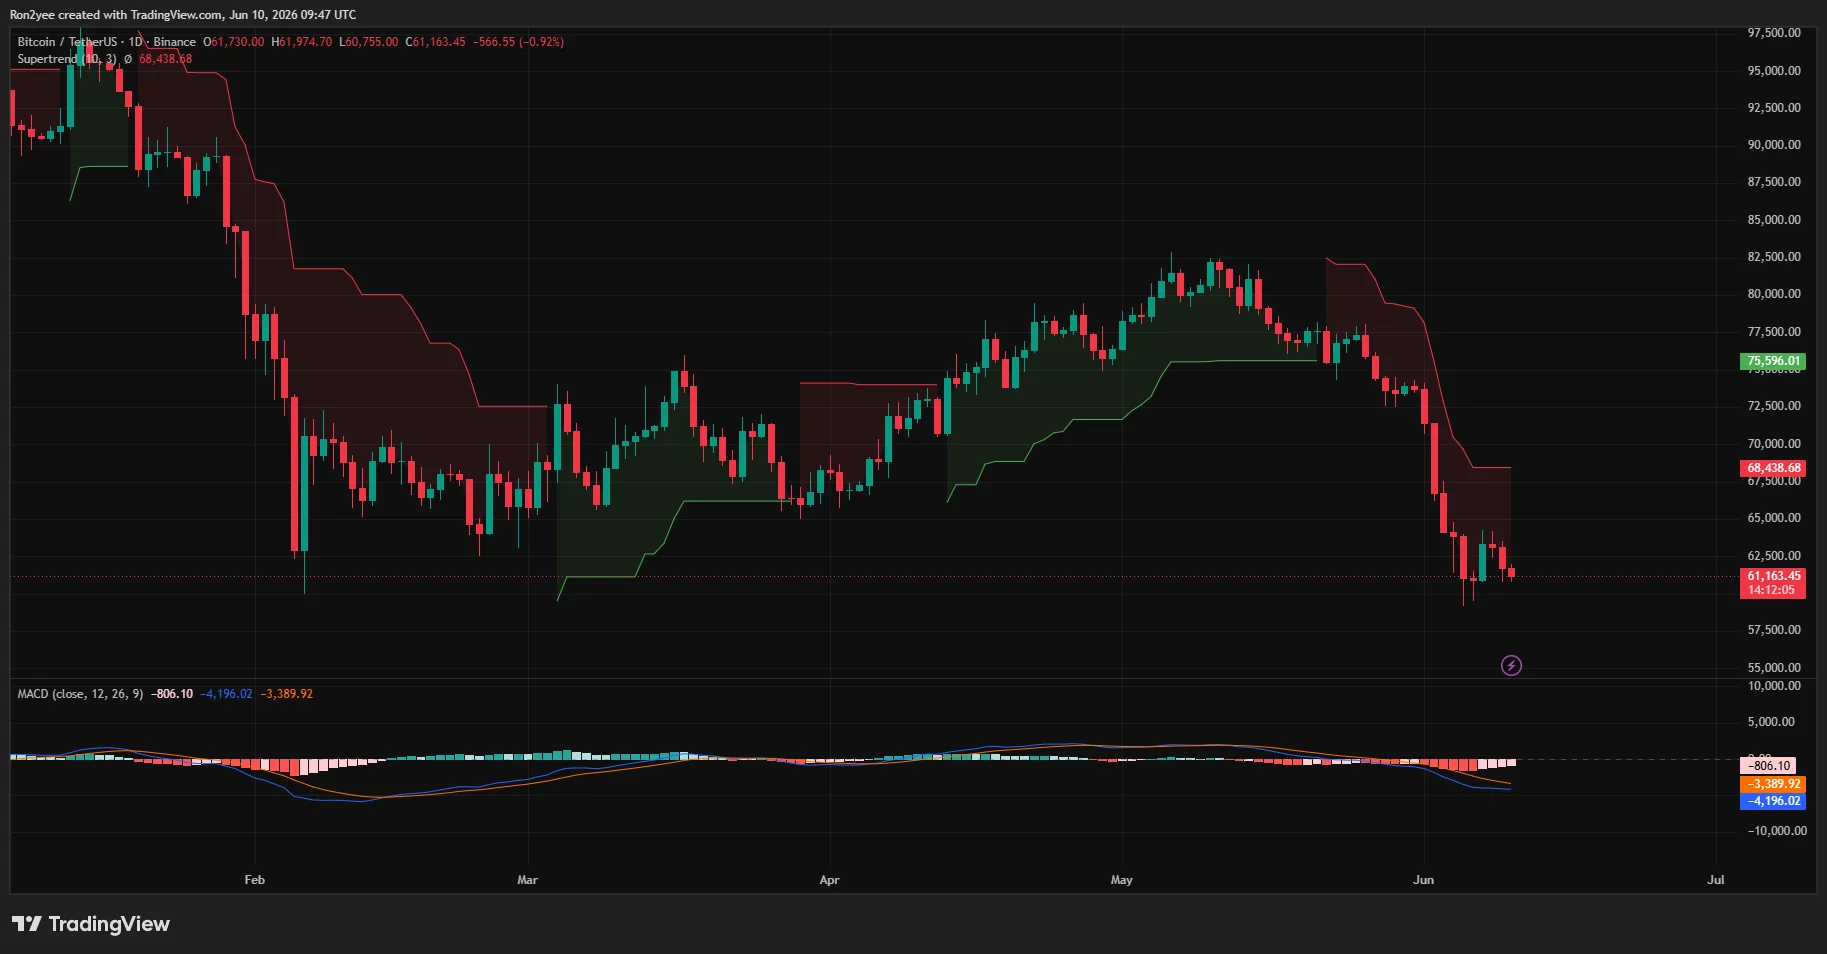 Bitcoin daily price chart — June 10 | Source: crypto.news
Daily price action has also produced a sequence of lower highs and lower lows since Bitcoin failed to hold above $80,000, a pattern often associated with sustained downtrends. Momentum indicators remain weak, with the daily MACD still below the zero line despite signs that selling pressure has eased slightly.
Commenting on the current setup, analyst Ted Pillows said Bitcoin could still experience a final liquidity sweep before attempting a recovery.
“A sweep of $60,000 zone could happen next, as stocks are showing weakness too. If $60,000 holds, then BTC will have a decent bounceback towards $65,000.”
Per the analyst, a failure to hold that support area could expose Bitcoin to another leg lower.
$BTC is almost back to the $61,000 level.
A sweep of $60,000 zone could happen next, as stocks are showing weakness too.
If $60,000 holds, then BTC will have a decent bounceback towards $65,000.
Otherwise, it'll drop to new yearly lows. pic.twitter.com/F3xik2tDaJ
Meanwhile, fellow analyst Lennaert Snyder identified the previous day’s low near $60,800 as another important support level. Snyder noted that liquidity remains concentrated around $65,000 and above $68,000, though he maintained a bearish bias unless Bitcoin can reclaim nearby resistance zones.
Longer-term indicators continue to highlight a larger support region between roughly $50,000 and $55,000. The weekly chart shows that the zone served as a major consolidation range throughout 2024. Should Bitcoin lose the current support area, traders are likely to monitor that range as the next major test of the asset’s market structure.
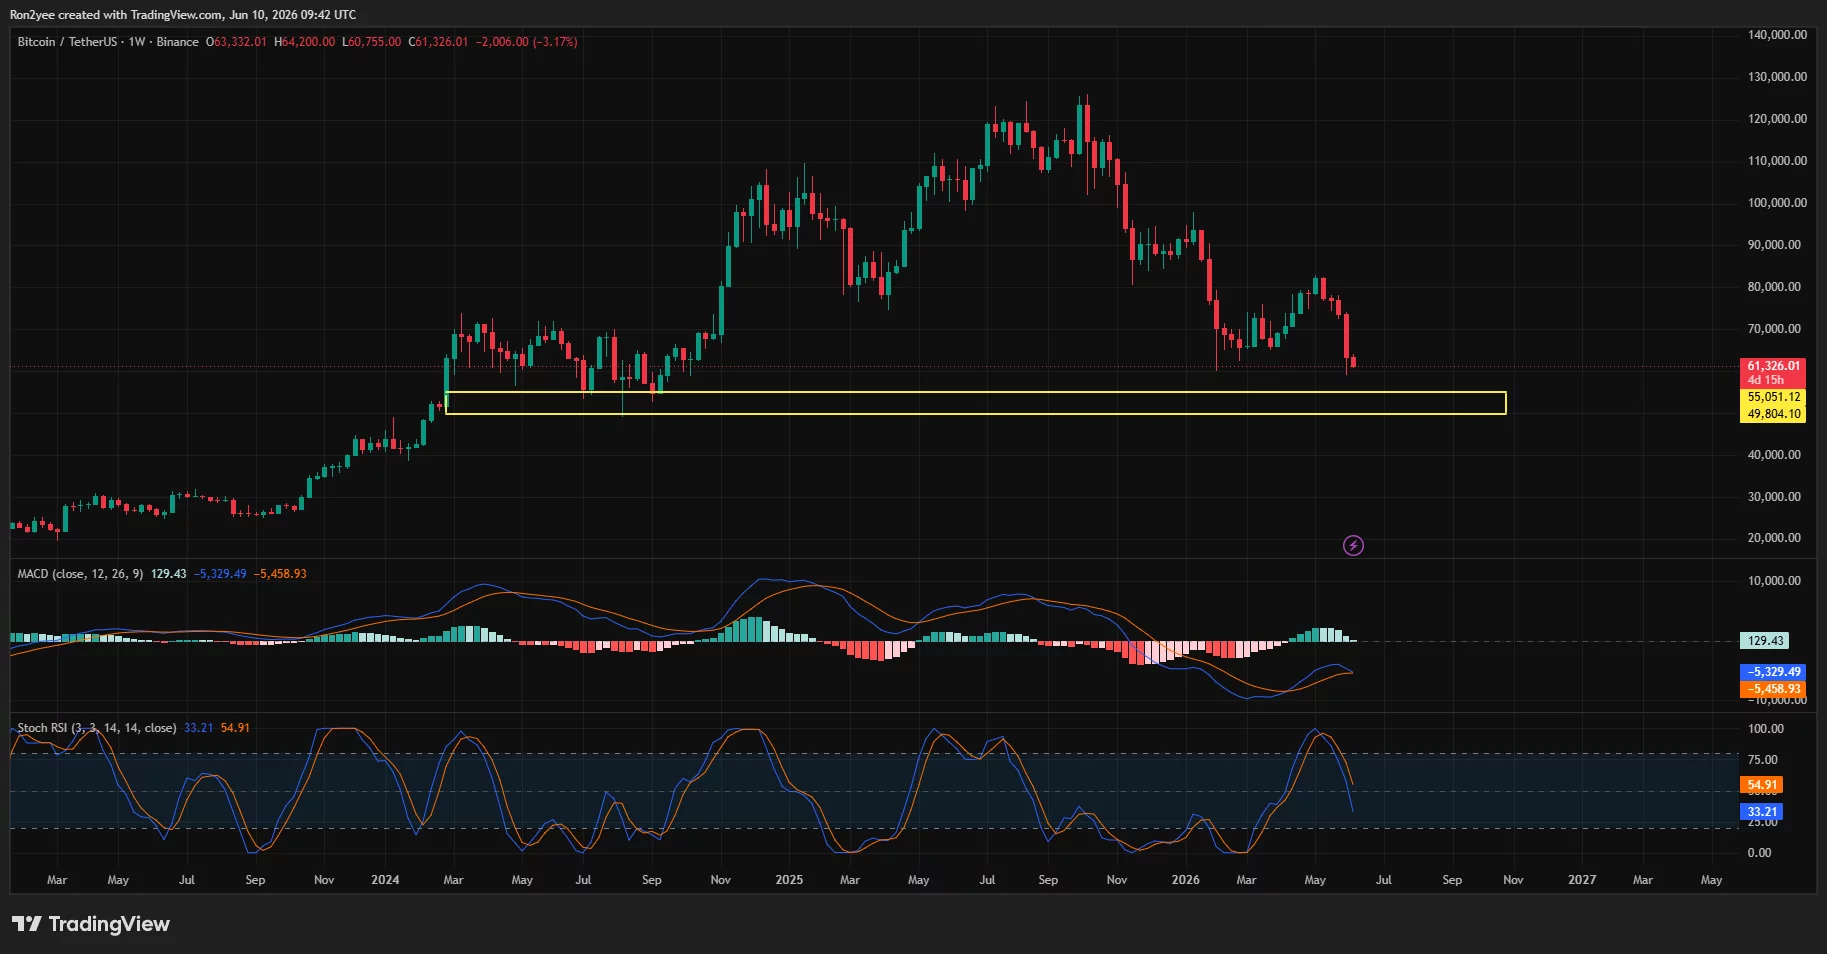 Bitcoin price is approaching the next support range between $50K and $55K on the weekly chart — June 10 | Source: crypto.news
 Disclosure: This article does not represent investment advice. The content and materials featured on this page are for educational purposes only.


 English (US) ·