 2 hours ago
2
2 hours ago
2
Bitcoin Price Hits New ATH — But the Momentum Fades
Bitcoin ($BTC) officially reached a new all-time high this week, spiking to around $123,000 before retracing back to the $118,000 zone. The rally was explosive and confirmed bullish momentum across the board, but as of now, consolidation has taken over. The big question on everyone’s mind: Is this just a cooldown — or the start of a deeper pullback?
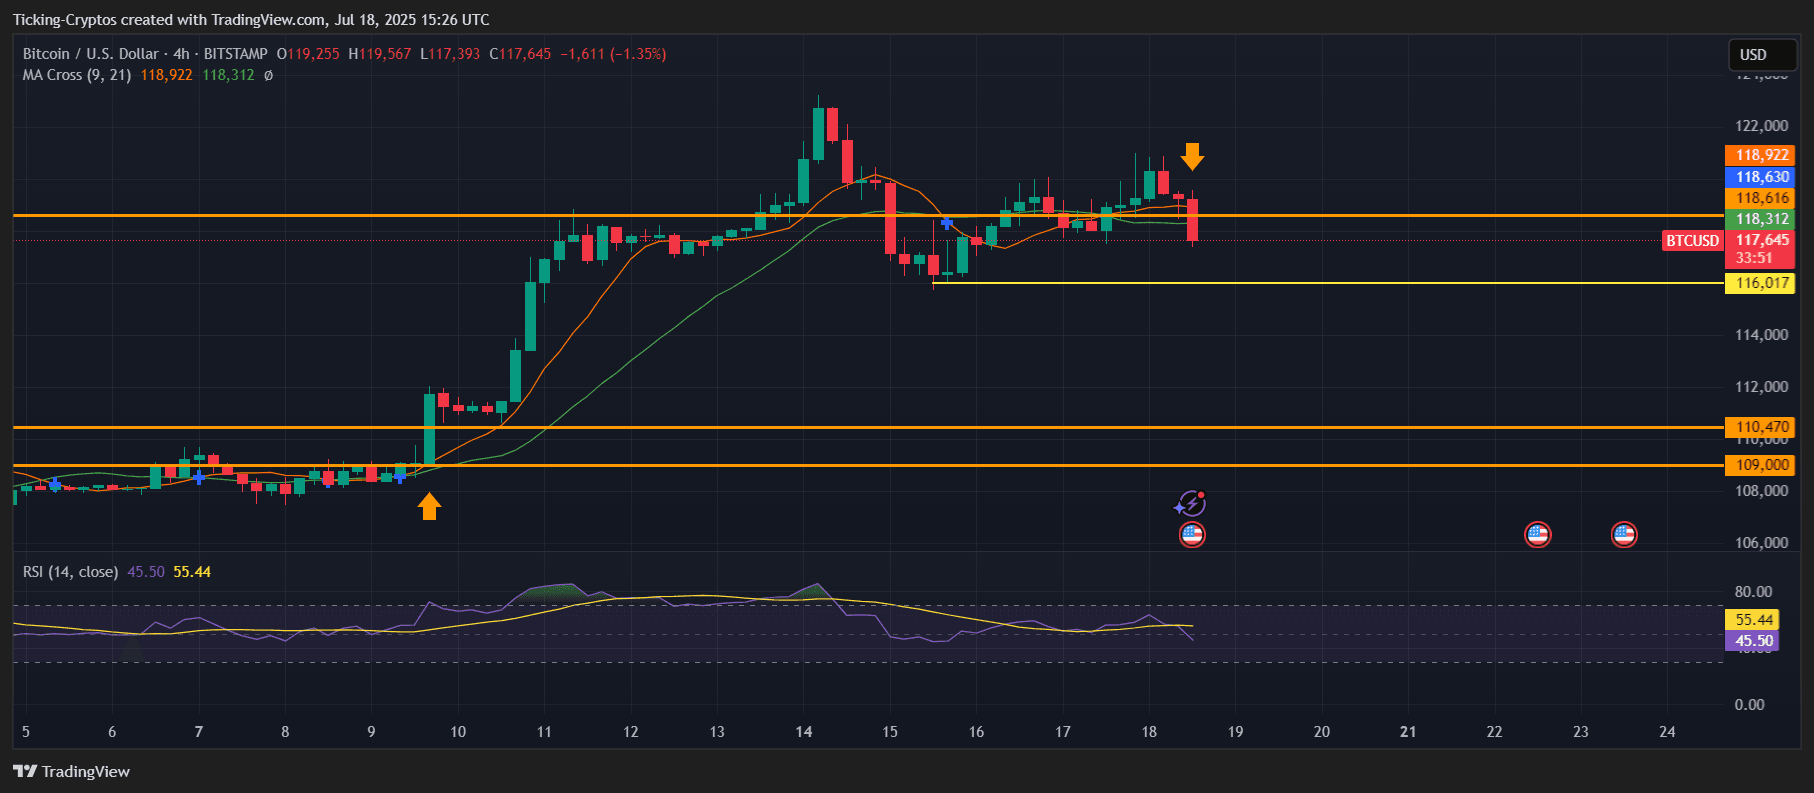
BTC/USD 4-hours chart - TradingView
A quick look at the 4H chart (attached) shows signs of short-term weakness, but also critical support zones that could act as buffers before a major crash.
Bitcoin Chart Analysis: Is $110K the Next Stop?
The current 4-hour chart reveals some important technical signals:
- Support at $118,000 has just been broken, as seen by the red candle drop below the orange horizontal zone and both MA lines (9 and 21 EMA).
- Next major support is marked at $116,000, which aligns with the previous consolidation zone from earlier in the month.
If $116,000 fails to hold, the $110,470 and $109,000 levels come into play — zones that many analysts now mention as potential retracement targets.
The RSI indicator is also signaling weakening momentum. With a current RSI around 45.5, the bullish strength is cooling, and traders might be heading into a more cautious phase.

Bearish or Just a Healthy Correction?
While a drop to $110,000 is definitely possible, it doesn’t necessarily signal the end of the bull run. In fact:
- The macro trend remains bullish, with BTC still trading well above its 21 EMA on the daily.
- The last correction brought BTC down only ~7% before buyers stepped in — a standard move after a parabolic rise.
As long as Bitcoin remains above $109K–$110K, the structure stays intact for another push higher in the coming weeks.
Bitcoin Price Prediction: What to Watch Next for BTC Price?
If $Bitcoin reclaims the $118K zone and prints a higher low, bulls might regain control and test $123K again. However, if sellers dominate and push BTC below $116K, prepare for a deeper dip toward $110K — where bargain hunters might step back in.
Keep an eye on RSI recovery, price action around $116K, and potential bullish divergence. This is a key zone that could dictate the next big move.


 English (US) ·