Bitcoin price struggles to gain ground as gold solidifies its status as a better safe-haven asset amid the ongoing trade-related risks.
Summary
- Bitcoin price has formed a double-top pattern on the daily chart.
- Gold has become a better safe-haven asset as it hits an all-time high.
- It has benefited from institutional and central bank purchases.
Gold is beating Bitcoin as a safe-haven asset
Bitcoin (BTC) continued to trade near $110,000, down by 12% from its highest point this year, meaning that it has moved into a technical correction. It is a few points above its lowest point last week.
In contrast, the gold price has jumped to a record high of $4,200 and is up 60% this year. Bitcoin’s price has risen by less than 20% this year, and the spread between the two is widening.
At the same time, the gap between the assets under management of the iShares Bitcoin Trust and the SPDR Gold Trust has continued to widen. IBIT now has $91 billion in AUM, while the GLD ETF has accumulated more than $138 billion.
The divergence between gold and Bitcoin’s role as safe-haven assets became clearer on Friday during the crypto market crash. Bitcoin’s price plunged to $106,000 after Donald Trump floated 130% tariffs on Chinese goods, as gold’s rally accelerated.
Gold is benefiting from ongoing demand from institutions, retail investors, and central banks. Indeed, central banks’ gold holdings have surpassed the U.S. dollar for the first time since 1996.
Still, Bitcoin’s role as a safe haven should not be ignored. For one, spot Bitcoin ETFs, which were launched in January last year, have accumulated $27 billion in inflows in 2025, bringing the cumulative flows to more than $62.5 billion.
Also, while gold has had a role as a store of value for centuries, Bitcoin has been around for less than 17 years. Most notably, Deutsche Bank has predicted that central banks will start buying Bitcoin by 2030, which will boost its value.
Additionally, Bitcoin’s price has beaten gold in the long term. It has jumped by 861% in the last five years, while gold is up by about 105% in the same period.
Bitcoin price technical analysis points to more downside
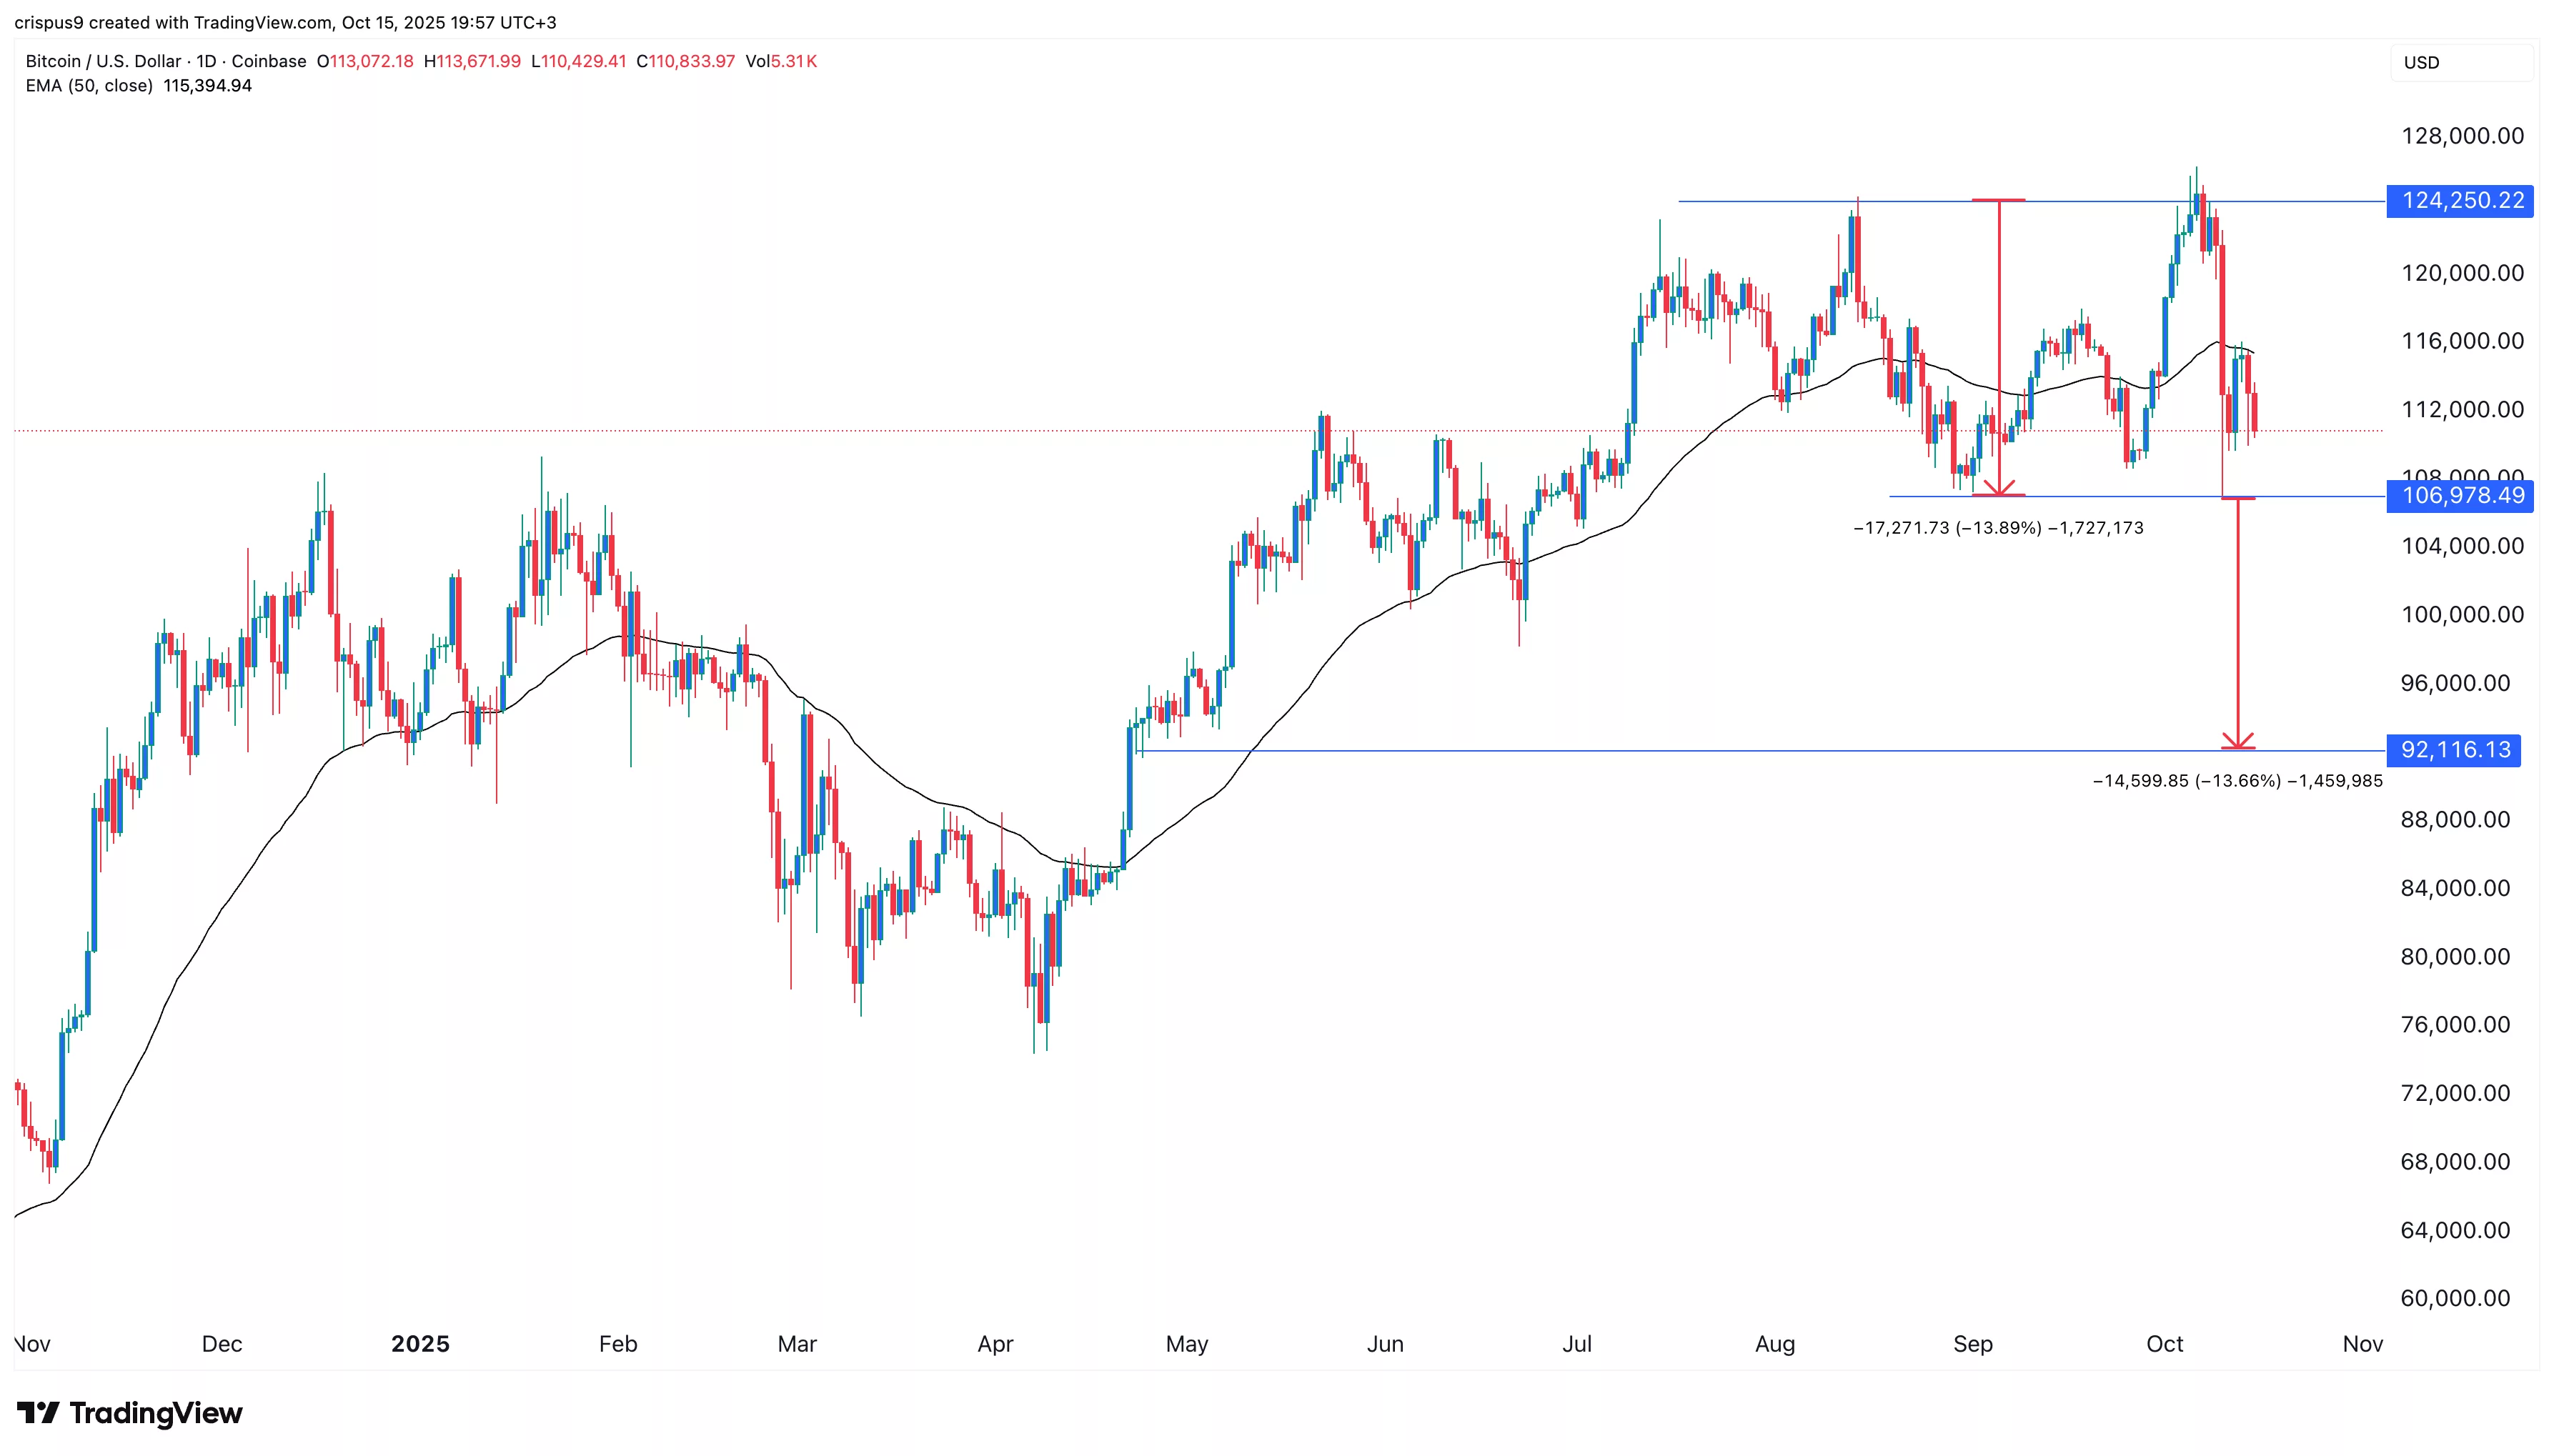 BTC price chart | Source: crypto.news
The daily time frame chart shows that the Bitcoin price has crashed in the past few days. It has plunged below the 50-day moving average. It has also formed a double-top pattern with a neckline at $106,978, its lowest point on Sept. 1.
The distance between the double-top point and the neckline is about 13.8%. Measuring the same distance from the neckline gives a target of $92,115.


 English (US) ·