 1 month ago
20
1 month ago
20
Bitcoin’s price action has pushed a closely watched on-chain profitability gauge into a configuration that, in 2022, preceded an extended drawdown and one analyst says a break below $70,000 would risk repeating that “year-long” reset.
In a Dec. 30 morning brief, Axel Adler Jr. argued that Bitcoin’s “Supply in Profit” trend is at an inflection point after BTC stabilized in the $87,000–$90,000 range following the pullback from October highs. The metric, which tracks how much BTC is held above its acquisition price, has fallen sharply from October peaks above 19 million BTC to roughly 13.2 million BTC, creating a sizable gap between short- and medium-term moving averages.
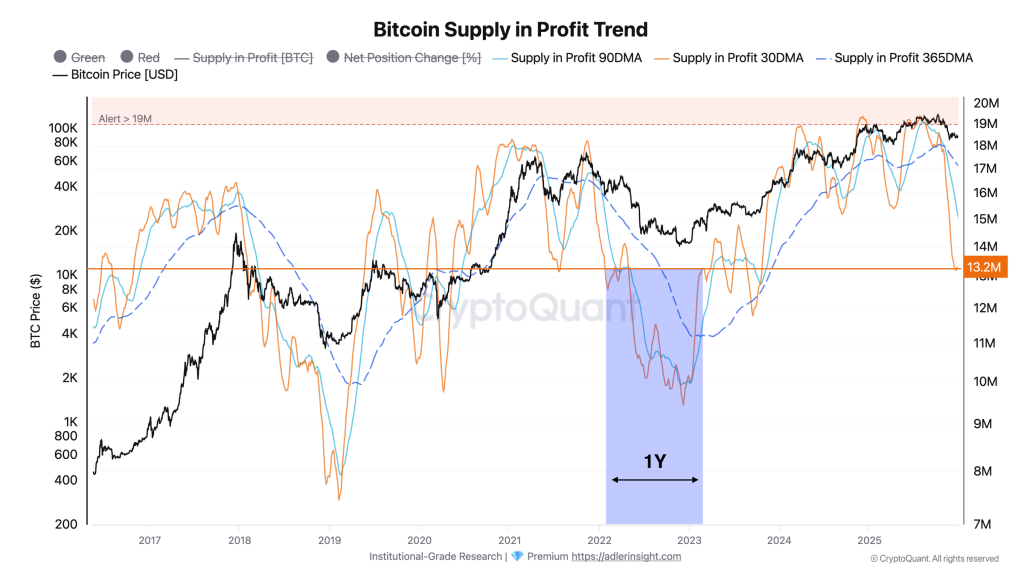 Bitcoin Supply in Profit chart with three moving averages | Source: Axel Adler
A 2022-Like Setup Looms For Bitcoin
Adler’s core signal is the spread between the 30-day and 90-day simple moving averages of Supply in Profit. After the correction from the all-time high, the 30-day average “dropped significantly below” the 90-day, forming a gap of about 1.75 million BTC.
Adler noted that “a similar configuration was observed in 2022 before an extended bearish period,” but stressed an important distinction this time: the 365-day moving average remains “at historically elevated levels for now,” implying the longer-term profit structure hasn’t fully rolled over.
The near-term question is whether the 30-day trend has bottomed. Adler flagged Dec. 18 as a local minimum for the 30-day average and said it is now “beginning to turn around,” with confirmation tied to a simple condition: Supply in Profit must hold above its 30-day average, which in practice requires BTC to keep its footing at current levels or higher.
Adler’s projection for a bullish recovery in this signal is unusually specific: he estimates the gap between the 30-day and 90-day averages is narrowing at roughly 28,000 BTC per day, mainly because the 90-day average is being pulled down mechanically as high October values roll out of the window.
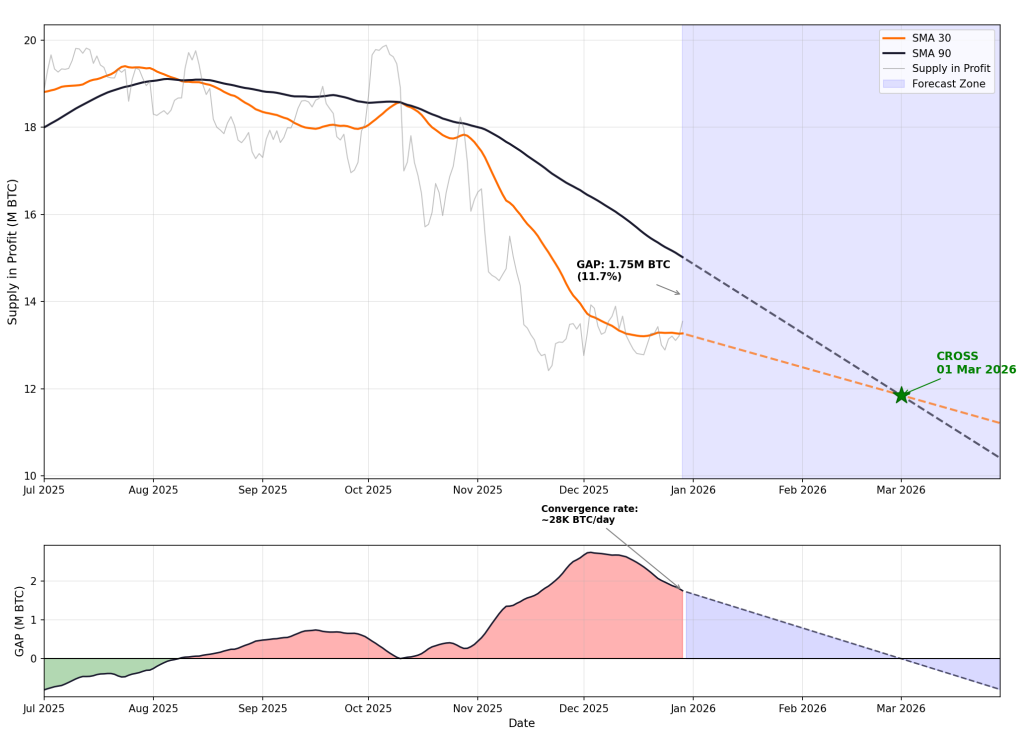 SMA crossover forecast | Source: Axel Adler
“Why is SMA 90 falling while price remains stable?” Adler wrote in the brief’s FAQ. “This is a mechanical effect of the moving average: values from early October are now dropping out of the 90-day window, when Supply in Profit was at peaks of 18–20M BTC with price at $115–125K. Even with stable current Supply, this pulls the average down.”
That rollover effect, Adler said, should persist through late January, providing a “tailwind” that could allow the 30-day line to reclaim the 90-day line even without a dramatic surge in Supply in Profit. If the current rates of change hold, Adler projects a bullish cross — where the 30-day average rises above the 90-day — in late February to early March.
The Invalidation: $70,000
The forecast, however, is explicitly price-sensitive. Adler estimated Supply in Profit has “elasticity to price” of 1.3x, meaning a 10% BTC drawdown could translate into about a 13% drop in the supply held in profit. In his model, the market’s critical fault line is the $70,000 zone.
“At what price does the cross scenario get invalidated?” Adler wrote. “The critical zone is below $70K. At that level, Supply would fall to ~10M BTC, and SMA 30 would begin declining faster than SMA 90. The GAP would stop narrowing and shift to expansion, postponing the bullish signal indefinitely.”
In that scenario, Adler said the setup would more closely mirror 2022: the spread expands rather than compresses, and the bullish cross gets pushed out, with recovery potentially taking “up to one year.” By contrast, he framed the constructive path as holding above $75,000–$80,000 through January, keeping Supply in Profit supported and preserving the convergence pace.
At press time, BTC traded at $88,102.
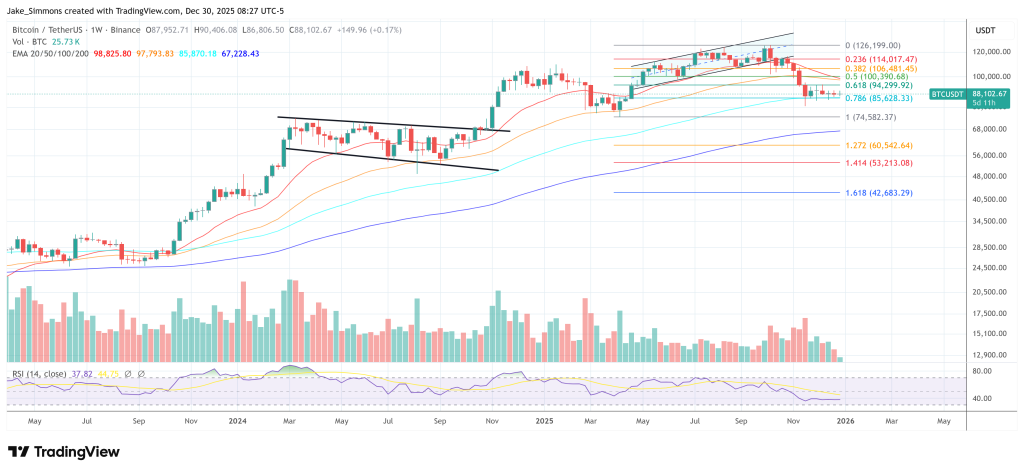 Bitcoin remains between the 0.618 and 0.786 Fib, 1-week chart | Source: BTCUSDT on TradingView.com
Featured image created with DALL.E, chart from TradingView.com


 English (US) ·