Binance Coin continued to consolidate at a crucial resistance level as the number of transactions in the network rose. It also wavered as its staking yield and inflows continued rising.
Binance Coin (BNB) price was trading at $600 on Friday, not far removed from its April high of $620.
The coin has several catalysts that may push it higher in the next few weeks. Nansen data shows that it is one of the most active chains in the crypto industry, recording over 31 million transactions in the last seven days. This figure surpasses other popular chains like Ethereum (ETH), Arbitrum (ARB), and Polygon.
BNB Chain’s active addresses rose by 13% in the last seven days to 5.2 million. In contrast, Ethereum had 2 million active addresses in the same period. The chain generated over $3 million in revenue.
The BNB price may also benefit from its staking statistics. StakingRewards data shows that its staking yield jumped by 214% on Friday to 6.2%, making it higher than many popular dividend stocks and exchange-traded funds.
More people are staking their BNB coins, with staking inflows rising by $10 million in the last 30 days.
Further data shows that BNB is deflationary, with its inflation rate moving to minus 4.4%. This deflation occurs due to its token burn mechanism. Its quarterly auto burn incinerates tokens worth over $1 billion each quarter, while its real-time burn removes at least 500 BNB coins from circulation.
BNB price may also benefit from ecosystem growth. The most recent major integration is Akedo, a multi-agent platform enabling creators to build and monetize game content on the network.
.@akedofun has integrated with BNB Chain!
This enables creators to build and monetize game content with AI agents while contributing to a growing Web3 creator movement.
Learn more 👇 https://t.co/hxETCljAk6
BNB price technical analysis
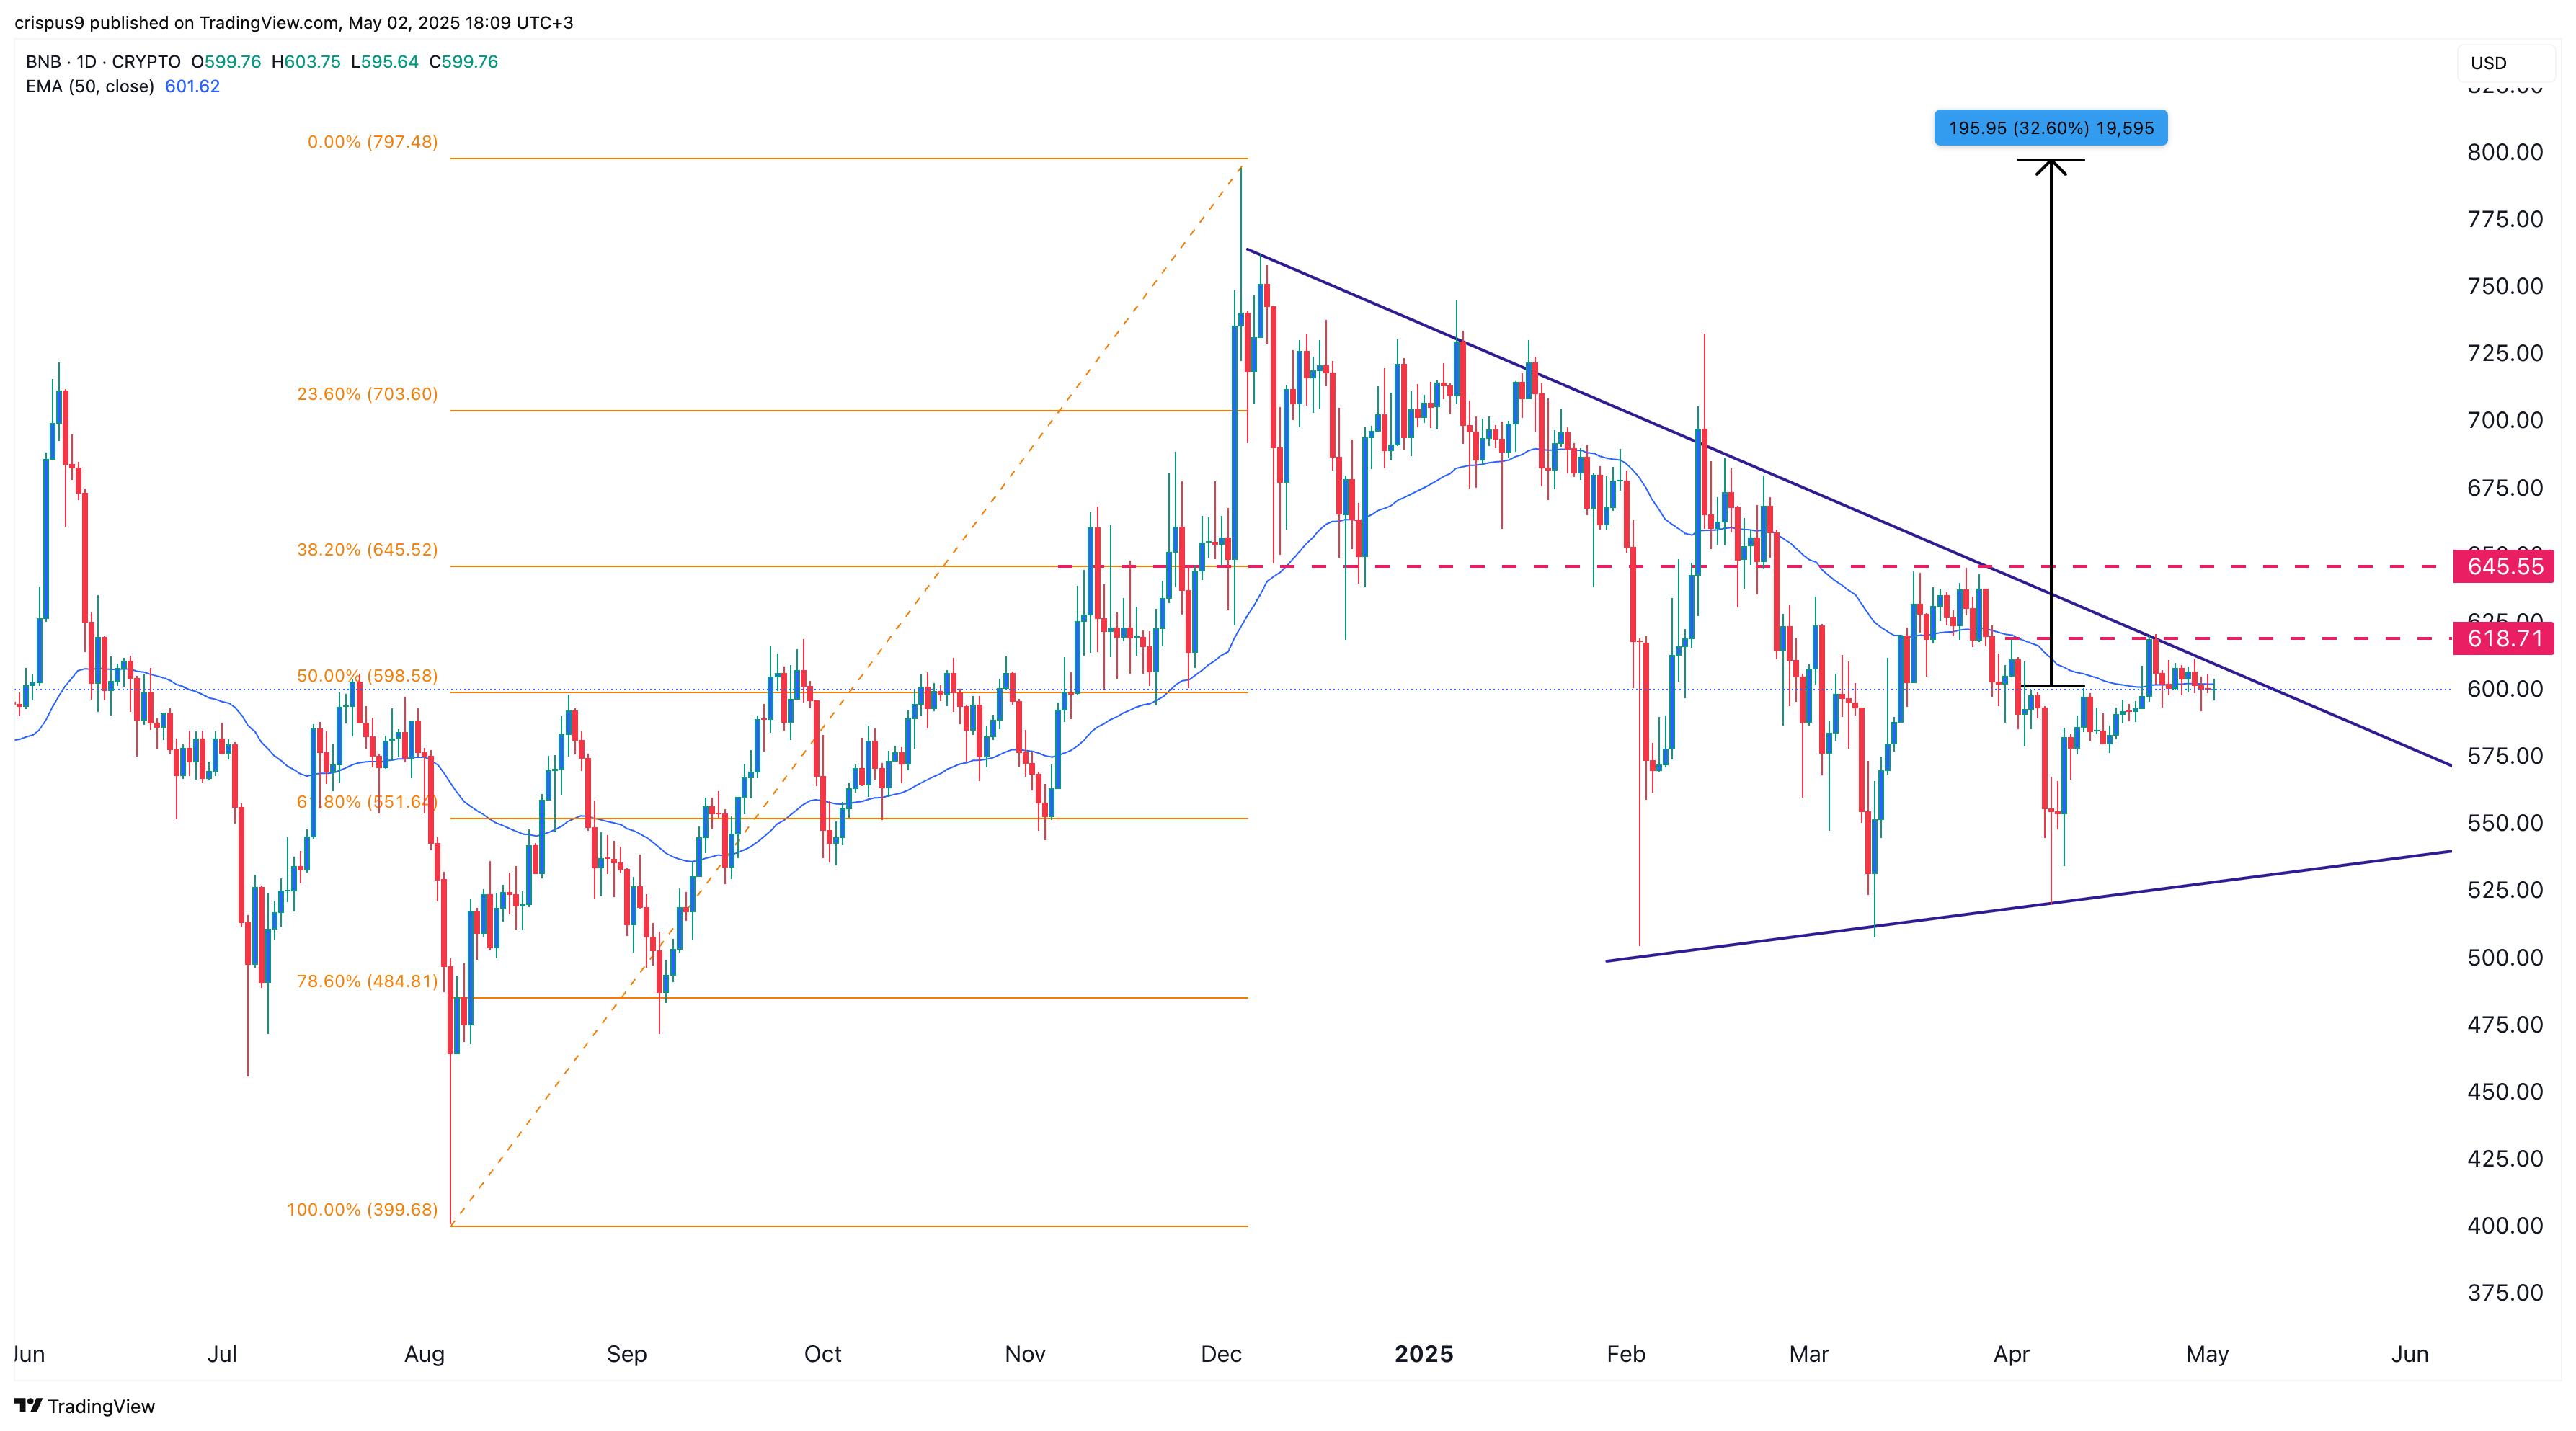 BNB price chart | Source: crypto.news
The daily chart shows that Binance Coin has remained in a tight range in recent days. This consolidation is occurring at the 50-day moving average and the 50% Fibonacci retracement level.
It is also happening along the upper side of the symmetrical triangle pattern. Also, it has formed an inverse head and shoulders pattern, signaling that a bullish breakout is possible.
If this happens, the next key level to watch will be at $645, the 38.2% retracement point. It may eventually rise by 32% to its 2024 high of $800.


 English (US) ·