 5 hours ago
2
5 hours ago
2
Bitcoin holds $120K after breakout, with analysts eyeing new ATH short-term and a possible 70% rise toward $203K by year-end if momentum continues.
Bitcoin was trading around $120,000 at press time, up slightly in the last 24 hours and 10% over the past week. The current 24-hour trading volume is approximately $64.2 billion. Traders are now watching the $120,000 level to see if it will act as new support, following a daily close above this key area.
Notably, the recent breakout is being compared to a similar move in mid-August, where a daily close above $120,000 led to a bounce toward $124,000 ATH. The price behavior around this level may help confirm the next direction in the short term.
$120K Breakout Mirrors August Move
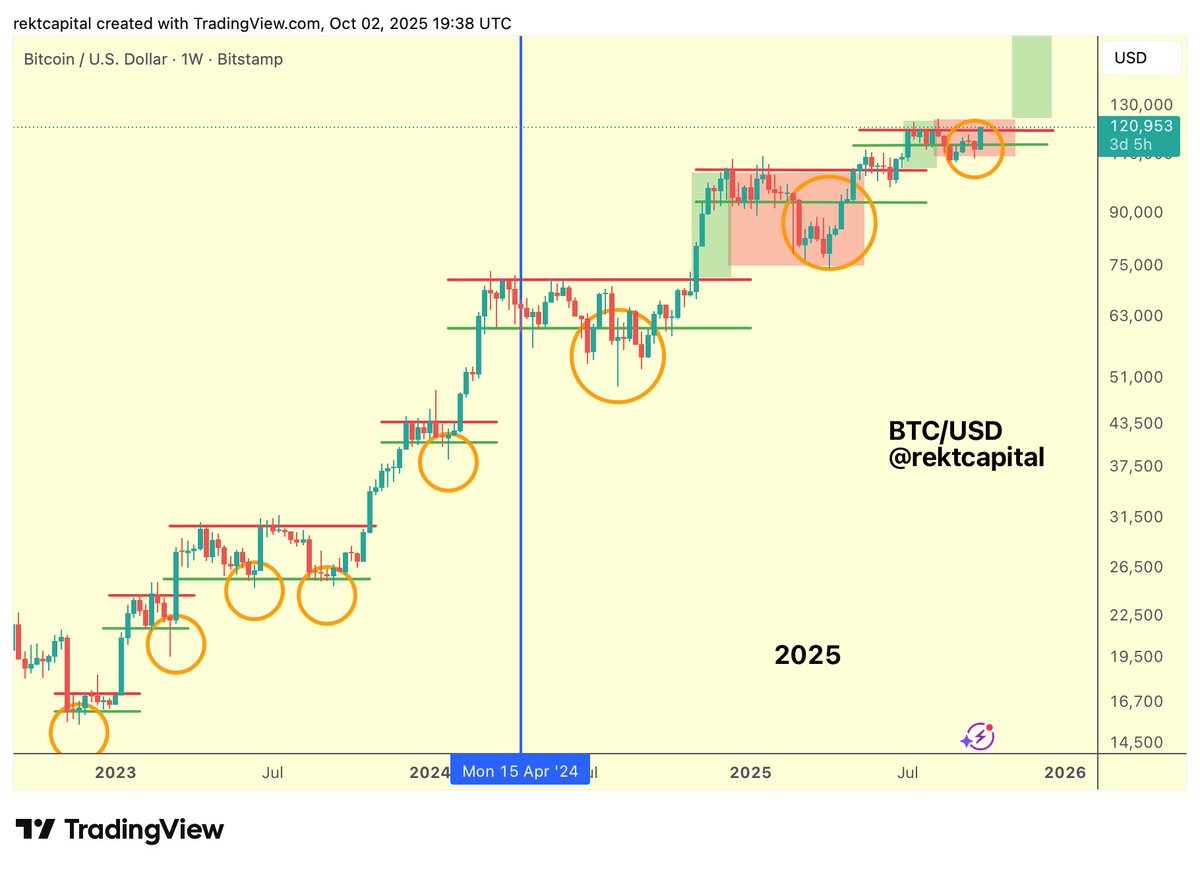
Analyst Rekt Capital posted that Bitcoin has performed a daily close above the $120,000 mark. In August, a similar close led to a successful retest of the same level as support, followed by a push toward $124,500. The chart shows both events marked with green circles.
Bitcoin has performed a Daily Close above ~$120k (black)
An identical Daily Close in mid-August (green circle) preceded a successful retest of $120k as new support before preceding upside into $123400 (red)
Will the not-too-distant history repeat?$BTC #Crypto #Bitcoin https://t.co/PwDpZqC8dH pic.twitter.com/IUPmTND4A9
— Rekt Capital (@rektcapital) October 3, 2025
Current price action is showing a repeat of that setup. If the level holds, the market may aim for $123,350 and beyond. If it fails to hold, nearby supports are located around $117,288 and $114,249. In another post, Rekt Capital added that Bitcoin is also testing a 2.5-month downtrend line near $119,000.
Additionally, on the weekly timeframe, the analyst referred to the possibility of Bitcoin entering “Price Discovery Uptrend 3.” The long-term chart shows a pattern that began in early 2023, where the price breaks out, retests resistance as support, and continues higher.
That structure has repeated at multiple stages. Bitcoin is now positioned at $120,000, and a weekly close above this level may support a continuation into new territory. A green zone on the chart marks the potential area for this movement.
You may also like:
- Will Markets Move Even Higher When $3.3B Bitcoin Options Expire
- Analyst: Bitcoin’s Healthy Volatility Band Points to Realistic $130K Target
- Over 127,000 Traders Wrecked as Bitcoin Taps $120K for the First Time Since August ATH
 Source: Rekt Capital/X
Momentum May Slow as RSI Peaks
On the 4-hour chart, analyst Ted Pillows pointed out that the RSI has reached 80.18, the highest level since July. The reading places BTC in overbought conditions on that timeframe.
$BTC 4H RSI is now the most overbought since the July top.
Usually such instances result in a correction or sideways price action for some time. pic.twitter.com/81EE4fu9FD
— Ted (@TedPillows) October 2, 2025
The RSI reading could suggest a pause or consolidation phase after the recent rally from below $110,000.
Monthly Chart Targets $203K by Year-End
Crypto Seth offered a long-term chart that shows BTC inside a growth channel. He noted the past rallies in the final quarter of the previous cycles: 368% in 2017 and 83% in 2021. Based on that, the analyst is now considering a 70% rise to around $203,530 by the end of 2025.
The chart shows that the price remains well within the bounds of the channel.
2017: $BTC pumped 368% last 3 months of the bull market.
2021: 83%
2025: 70% from now to Dec sounds reasonable? Surely with all the ETFs and adoption it can give me another 70%???? pic.twitter.com/6OSZPiWhTl
— Crypto Seth (@seth_fin) October 2, 2025
The structure remains intact, with no signals of a market top yet.
Binance Free $600 (CryptoPotato Exclusive): Use this link to register a new account and receive $600 exclusive welcome offer on Binance (full details).
LIMITED OFFER for CryptoPotato readers at Bybit: Use this link to register and open a $500 FREE position on any coin!


 English (US) ·