 1 month ago
34
1 month ago
34
Cardano may be sitting on one of the most significant buying opportunities in its history — with analysts projecting a potential 1,000% rally if a multi-year support zone continues to hold.
At roughly $0.27 at the time of writing, ADA has stayed above a demand floor that twice before marked a cycle bottom and launched sharp recoveries, fueling fresh optimism that a similar move could be building.
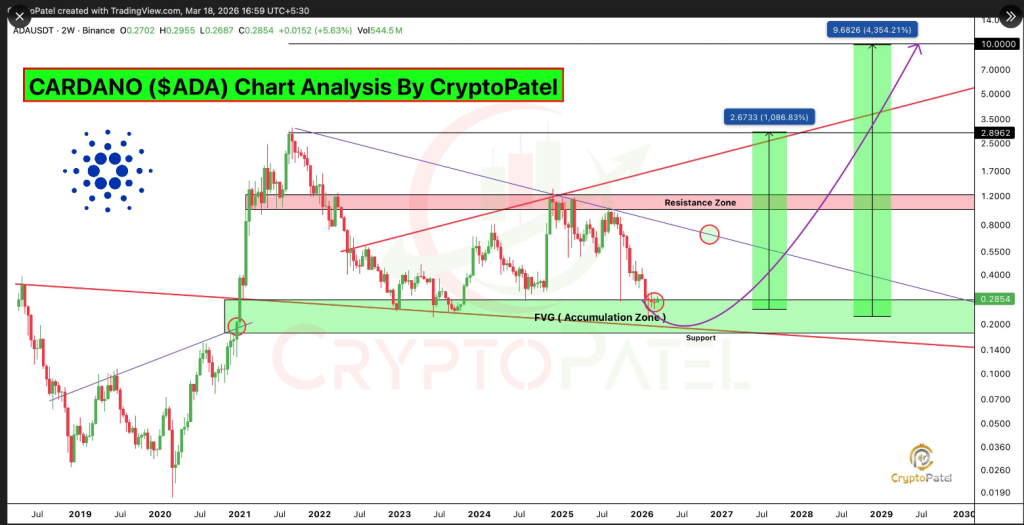
Market analyst Crypto Patel, citing a two-week chart, says the coin is compressing between a price floor of $0.18 to $0.25 and a descending resistance line in place since the 2021 all-time high. That kind of squeeze often precedes a sharper move in either direction — and bulls are betting on up.
The support band has attracted buyers more than once. Reports indicate the zone held during a steep decline in June 2023, when ADA hit $0.22, and buying pressure there helped push the coin to $1.32 by December 2024.
Before that, a similar setup played out in 2021, when ADA consolidated just above that level before climbing to a peak of $3.10.
$ADA Is Sitting on a Multi-Year Accumulation Zone That Could Send It 1,000%+ Higher….
Accumulation Zone: $0.25-$0.18
Targets: $1 ⮕ $3 ⮕ $10
NFA & ALWAYS DYOR@Cardano pic.twitter.com/pWG91sgtG6
— Crypto Patel (@CryptoPatel) March 18, 2026
The Numbers Behind The Targets
If history repeats, the path higher looks like this: a break above the descending resistance line puts $1 in view first — roughly 270% above current prices. From there, $3 becomes the next target, a gain of around 1,011% that aligns closely with the 2021 cycle peak. Under the most optimistic scenario, Crypto Patel puts $5 on the table — a rise of about 1,750%.
Those numbers are staggered and conditional. Each target only comes into play after the previous one is cleared. None of them are triggered by the support zone alone — the descending resistance line, which has capped every recovery attempt since 2021, must also give way.
ADA dropped to $0.2205 in February before buyers stepped back in. Since then, the coin has held mostly flat but has not broken below the support floor. According to the analyst, that matters. A sustained hold keeps the broader structure intact. A drop below $0.18 dismantles it.
A Long Wait For A Breakout
The current price action has been sideways for months. ADA is neither breaking out nor collapsing — just grinding within a narrow range while the two converging lines press closer together.
Reports note that extended consolidation of this kind often precedes a larger directional move, though the chart alone cannot determine which way that move goes.
The analyst’s projections are rooted in technical chart reading and historical cycle comparisons. No fundamental catalysts — new technology, partnerships, or adoption milestones — were cited as drivers in the analysis.
Featured image from Unsplash, chart from TradingView


 English (US) ·