 3 hours ago
2
3 hours ago
2
Key Notes
- Whales sold over 350M ADA in a week, triggering a 15% price crash.
- ADA trades within a large symmetrical triangle, testing support around $0.69.
- Indicators are neutral with the RSI at 45.6, MACD flattening, and CMF neutral.
Prominent crypto analyst Ali Martinez revealed that large Cardano ADA $0.69 24h volatility: 2.5% Market cap: $25.17 B Vol. 24h: $1.62 B whale addresses holding between 100 million and 1 billion ADA have sold approximately 350 million ADA tokens over the past week as uncertainty in crypto peaked.
350 million Cardano $ADA sold by whales in the past week! pic.twitter.com/M8tJyJ4HyU
— Ali (@ali_charts) October 15, 2025
This heavy distribution comes alongside a 15% weekly price decline. Such large-scale exits often point to profit-taking or a lack of confidence among major holders, triggering short-term bearish sentiment.
Whale Distribution Pressures ADA Price
According to Martinez, this selling phase comes after ADA briefly tested its multi-month resistance line as whales offloaded ADA at relatively higher levels.
However, on-chain metrics show no large-scale exchange inflows beyond the whale sell-off, indicating that retail holders are largely holding steady.
Martinez also added that ADA’s price structure remains within a large symmetrical triangle formation, a pattern that has been developing since 2022.
The analyst said that if ADA breaks above $0.9, the next target would be $1.8, making ADA a top crypto to buy in 2025.
Cardano $ADA above $0.90 = $1.88 next pic.twitter.com/h6mLxVlSAo
— Ali (@ali_charts) October 14, 2025
ADA Price Analysis: Testing Long-Term Support
The weekly chart shows ADA repeatedly rejecting the descending resistance line extending from its 2021 highs. Currently, ADA trades at $0.69, hovering just above the key horizontal support zone around $0.53-$0.71.
The Bollinger Bands reveal tightening volatility as ADA remains below the middle band near $0.76, confirming that sellers are still in control in the short term.
However, a breakout above this level could mark the early stages of recovery toward $0.90 and $1.
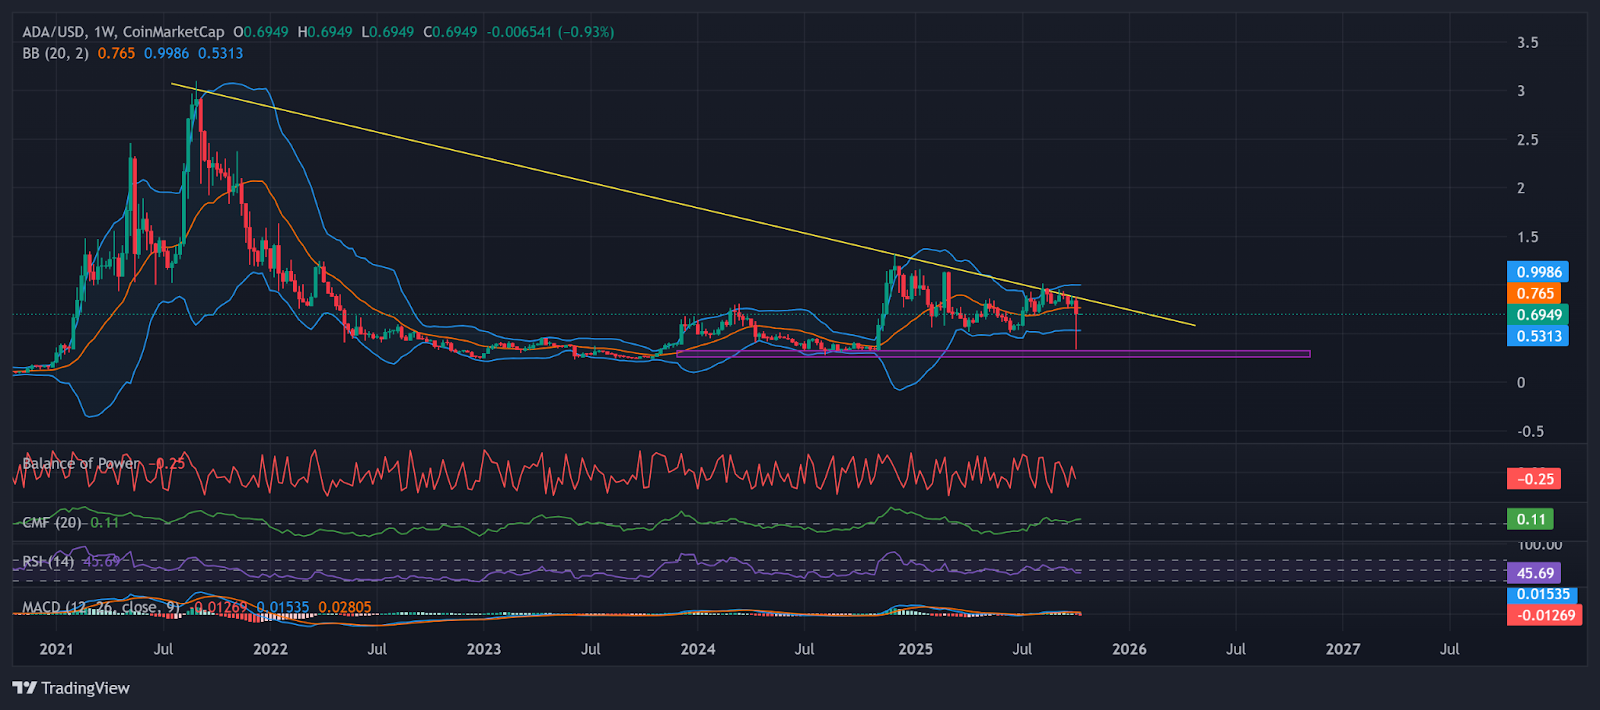
ADA weekly chart with momentum indicators. | Source: TradingView
On the other hand, the RSI sits around 45.6 and the MACD histogram is slightly negative but flattening. Also, the Chaikin Money Flow (CMF) remains near neutral at 0.11, showing that capital outflows are slowing down.
End of a Multi-Year Consolidation?
ADA must defend the $0.69-$0.53 range and break decisively above the descending trendline near $0.75-$0.80. Such a move could trigger a rally toward $0.90, followed by a breakout toward $1.8662, ending ADA’s multi-year consolidation.
The bearish scenario, however, would materialize if ADA fails to hold above $0.53. A weekly close below this level could invalidate the triangle pattern and send prices toward $0.40 or even lower, reopening the path to 2022 lows.
Disclaimer: Coinspeaker is committed to providing unbiased and transparent reporting. This article aims to deliver accurate and timely information but should not be taken as financial or investment advice. Since market conditions can change rapidly, we encourage you to verify information on your own and consult with a professional before making any decisions based on this content.

A crypto journalist with over 5 years of experience in the industry, Parth has worked with major media outlets in the crypto and finance world, gathering experience and expertise in the space after surviving bear and bull markets over the years. Parth is also an author of 4 self-published books.


 English (US) ·