Technicals for Chainlink have turned largely bearish as whales continue to offload their holdings to lock in profits.
Summary
- Chainlink price is down 16% over the past week.
- Whale selloffs have played a major role in LINK’s recent losses.
- The token’s price action appears to be nearing a bearish breakout from a symmetrical triangle.
According to data from crypto.news, Chainlink (LINK) price dropped to an intraday low of $14.57 on Wednesday, Nov. 5, before settling a little higher at $15.15 at press time. At this price, the altcoin is down 16.4% over the past 7 days and 36% lower than its October high.
Chainlink’s price declined as whales continued offloading their holdings, likely to lock in profits. Data from Nansen shows that the total balance of LINK tokens held by whales has dropped from 2.59 million on Oct. 31 to 1.87 million recorded today.
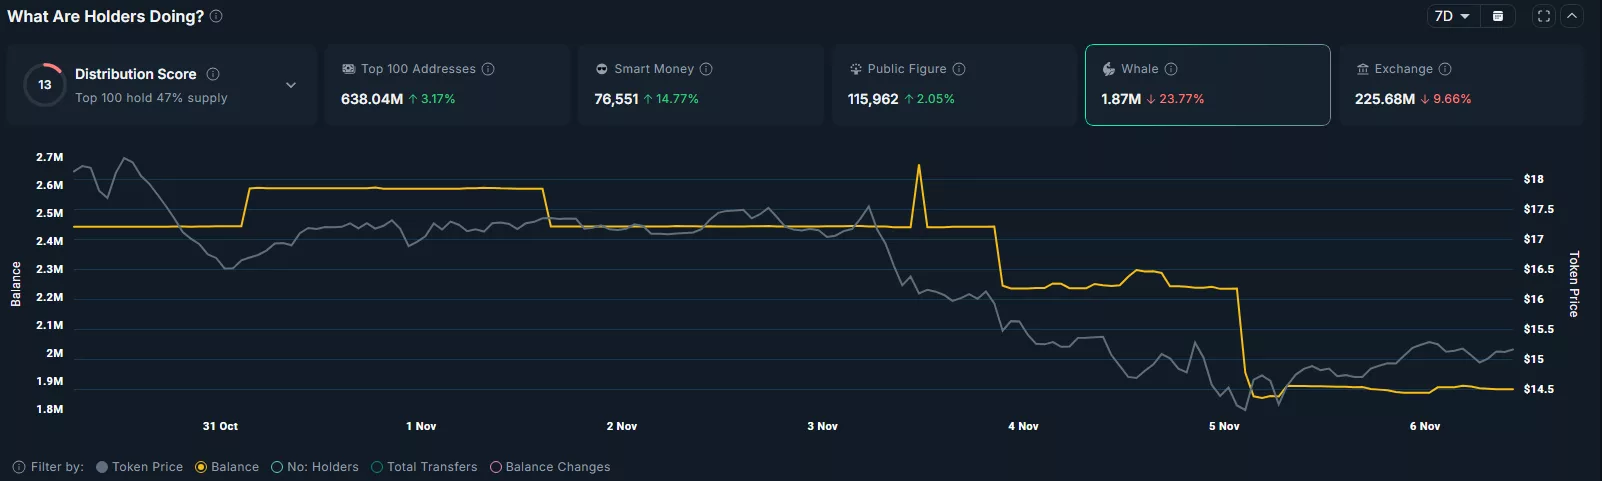 Source: Nansen
Such a trend of mass dumping by whales typically triggers panic among retail investors, who may also start selling, adding further pressure on the token’s price in the coming days, especially amid a weakening presence in the DeFi space.
The total value locked (TVL) on DeFi protocols using the Chainlink network has declined from over $1.1 billion in August to $650 million at press time, while weekly fees have dropped by 40% since mid-September, data from DeFiLlama show.
These bearish signs add up at a time when Chainlink price is close to confirming a major bearish setup that could potentially trigger a sharp correction for weeks to come.
Chainlink price has been trading within a multi-year symmetrical triangle that it entered following its drop in August 2024. A symmetrical triangle is a neutral pattern characterized by converging trendlines, one descending and one ascending, reflecting a period of consolidation. However, a break below the lower trendline of the pattern is usually considered a bearish signal that can lead to further downside.
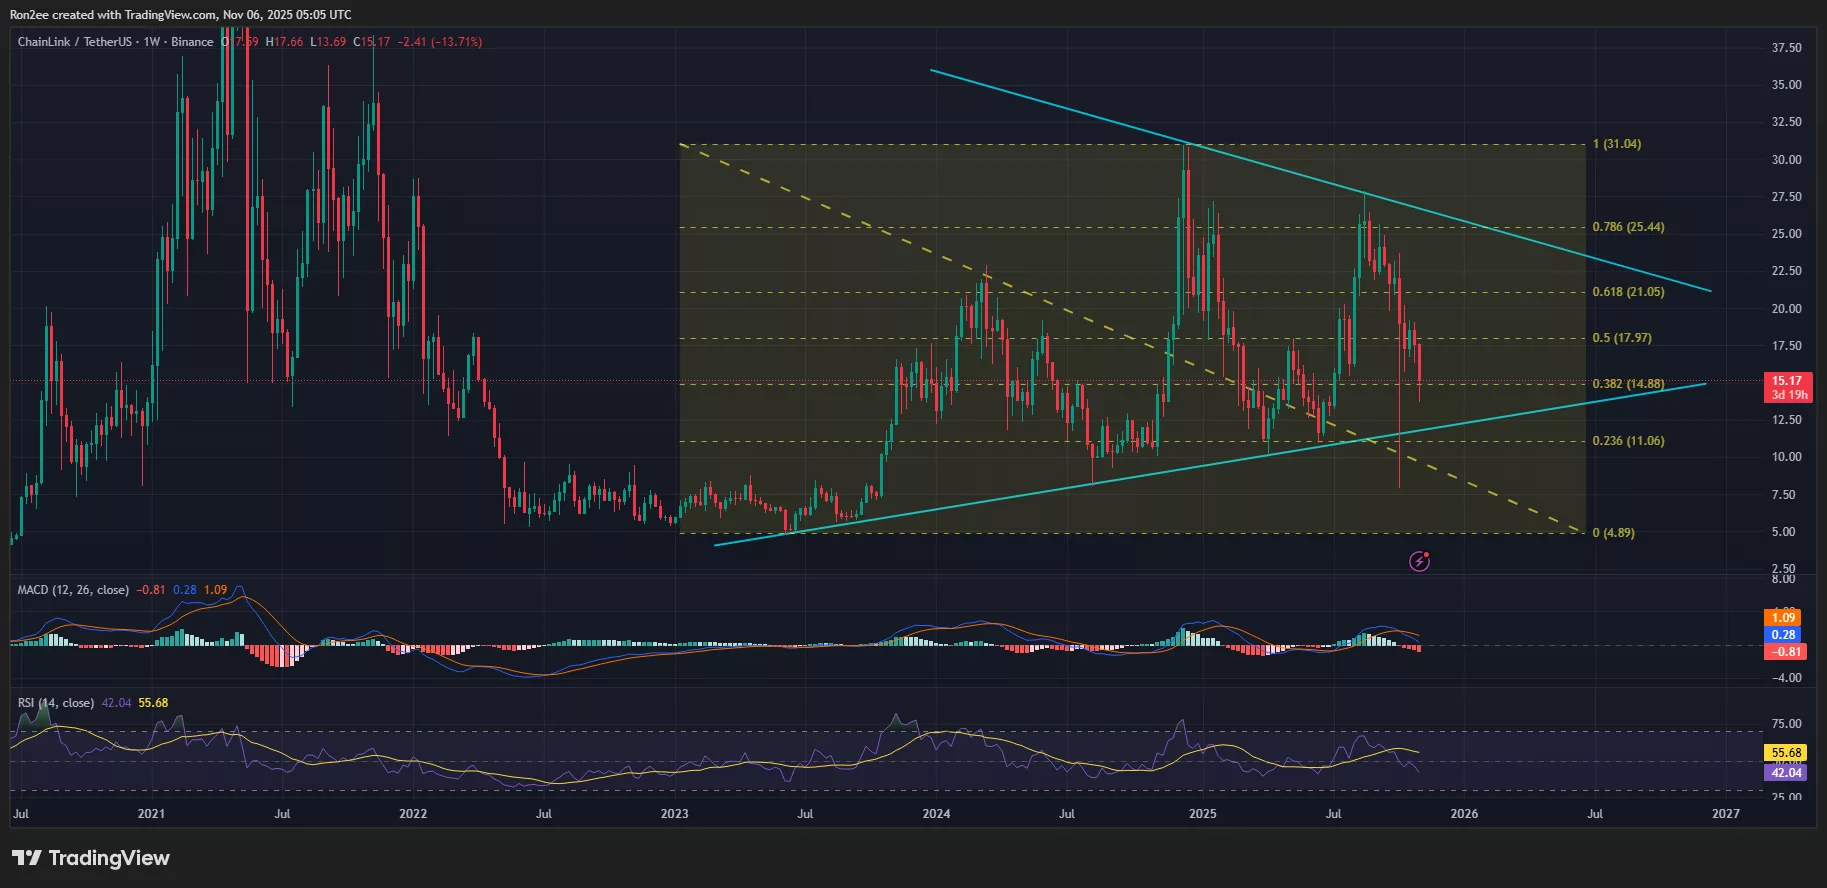 Chainlink price is eyeing a bearish breakout from a symmetrical triangle on the weekly chart — Nov. 6 | Source: crypto.news
Since mid-August this year, its price has been on a steady downtrend, edging closer to the lower trendline and now appears likely to break below it, as other technical signals seem to support a bearish move.
Notably, the MACD lines have formed a bearish crossover, while the RSI has been in a sustained downtrend after hitting near overbought levels earlier in August. Both these indicators point to fading bullish momentum and rising selling pressure.
When taken together, they appear to signal an upcoming crash in the token’s price.
For now, $14.88, which aligns with the 38.2% Fibonacci retracement level, acts as the immediate support. A breakdown below this level could open the path for a deeper correction toward $11.
A drop to that level would then confirm a bearish breakout from the symmetrical triangle and could signal a larger crash to $4.89, or even lower, if bearish momentum persists.
Bullish fundamentals still at play
The bearish technical setup for Chainlink price contrasts sharply with a backdrop of strengthening fundamentals marked by a surge in adoption of its services.
On Nov. 6, SBI Digital Markets named Chainlink’s CCIP as its exclusive interoperability infrastructure for its tokenized asset platform, as it deepened its integration into institutional finance.
Separately, Chainlink is powering the on-chain launch of the S&P Digital Markets 50 Index. Chainlink will provide real-time, verified data for the crypto–equity hybrid benchmark via its oracle network in partnership with Dinari and S&P Dow Jones Indices.
Disclosure: This article does not represent investment advice. The content and materials featured on this page are for educational purposes only.


 English (US) ·