 10 hours ago
1
10 hours ago
1
Key Notes
- Digital asset investment products have seen $1B+ inflows for 12 consecutive weeks, totaling $18B.
- Ethereum (ETH) inflows now average 1.6% of AuM weekly, outperforming Bitcoin’s 0.8%.
- The US dominates crypto inflows, while Canada and Brazil show bearish divergence.
For the twelfth straight week, digital asset investment products have recorded inflows topping $1 billion, continuing a remarkable streak of investor confidence in the crypto market.
Last week alone, $1.04 billion poured into digital assets, driven primarily by US investors, according to the latest CoinShares report.
The cumulative inflow over this streak now totals a staggering $18 billion, pushing total assets under management (AuM) to a record $188 billion.
Geographically, the United States remains the engine of crypto capital, contributing $1 billion in inflows last week alone.
Germany ($38.5 million) and Switzerland ($33.7 million) showed moderate bullishness, while Canada (-$29.3 million) and Brazil (-$9.7 million) saw outflows.
Ethereum Outpaces Bitcoin
While Bitcoin BTC $108 625 24h volatility: 0.5% Market cap: $2.16 T Vol. 24h: $21.22 B continues to dominate in absolute numbers, with $790 million in inflows this week alone, Ethereum ETH $2 563 24h volatility: 1.9% Market cap: $309.42 B Vol. 24h: $13.78 B is quietly outperforming it in terms of relative growth.
Over the past 11 weeks, Ethereum’s average weekly inflow has been 1.6% of its AuM, double that of Bitcoin’s 0.8%. Last week, Ethereum added $226 million, marking its eleventh consecutive week of positive flows.
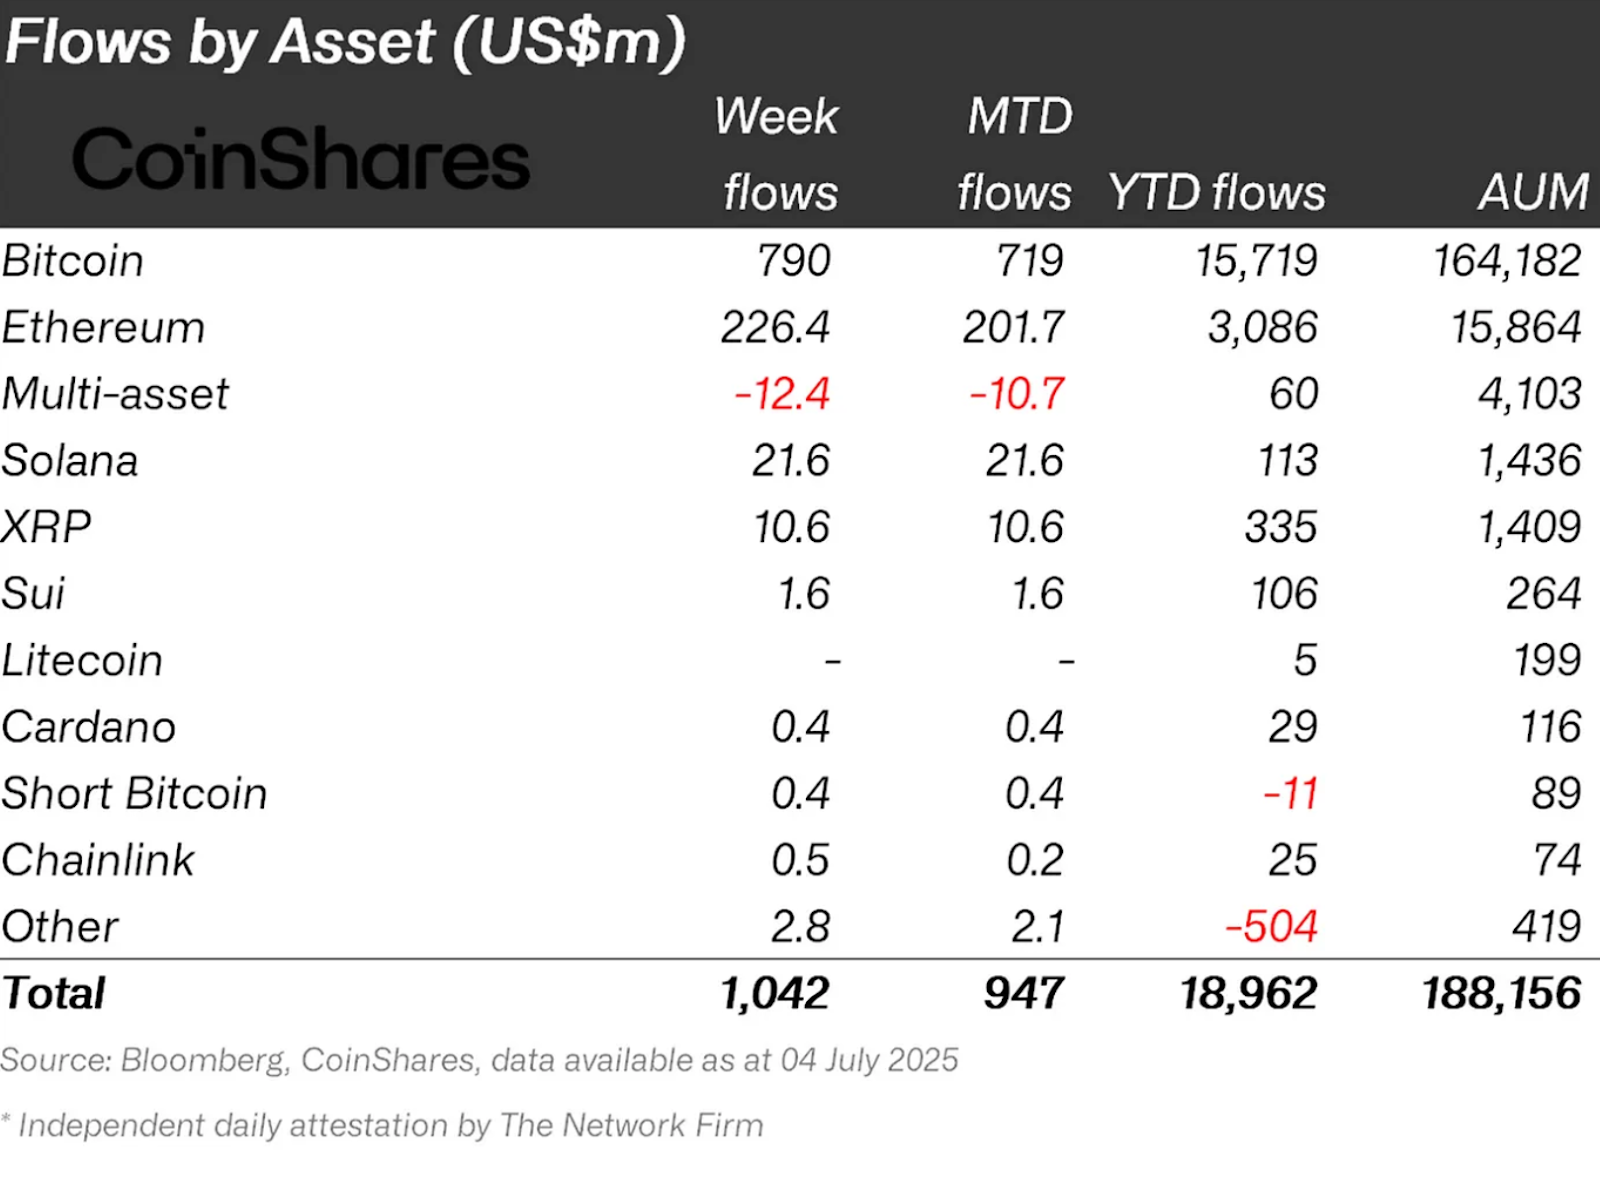
Flows by Crypto Asset | Source: CoinShares
While Bitcoin’s inflows have slowed from the $1.5 billion weekly average seen in the previous three weeks, perhaps due to its price hovering near all-time highs, ETH appears to be gaining favor among institutional and retail investors alike.
Macro Outlook: TOTAL3 Analysis
The Total Crypto Market Cap excluding Bitcoin and Ethereum (TOTAL3) weekly chart paints a cautiously optimistic picture. At the time of writing, TOTAL3 is hovering near $845 billion, above key support zones.
The Relative Strength Index (RSI) sits around 50.7, signaling a neutral stance after bouncing from sub-40 levels in recent weeks.
Meanwhile, the MACD histogram shows a negative reading, but the gap between the MACD line and the signal line is narrowing, often seen just before a potential bullish crossover, which would confirm a reversal of recent downside pressure.
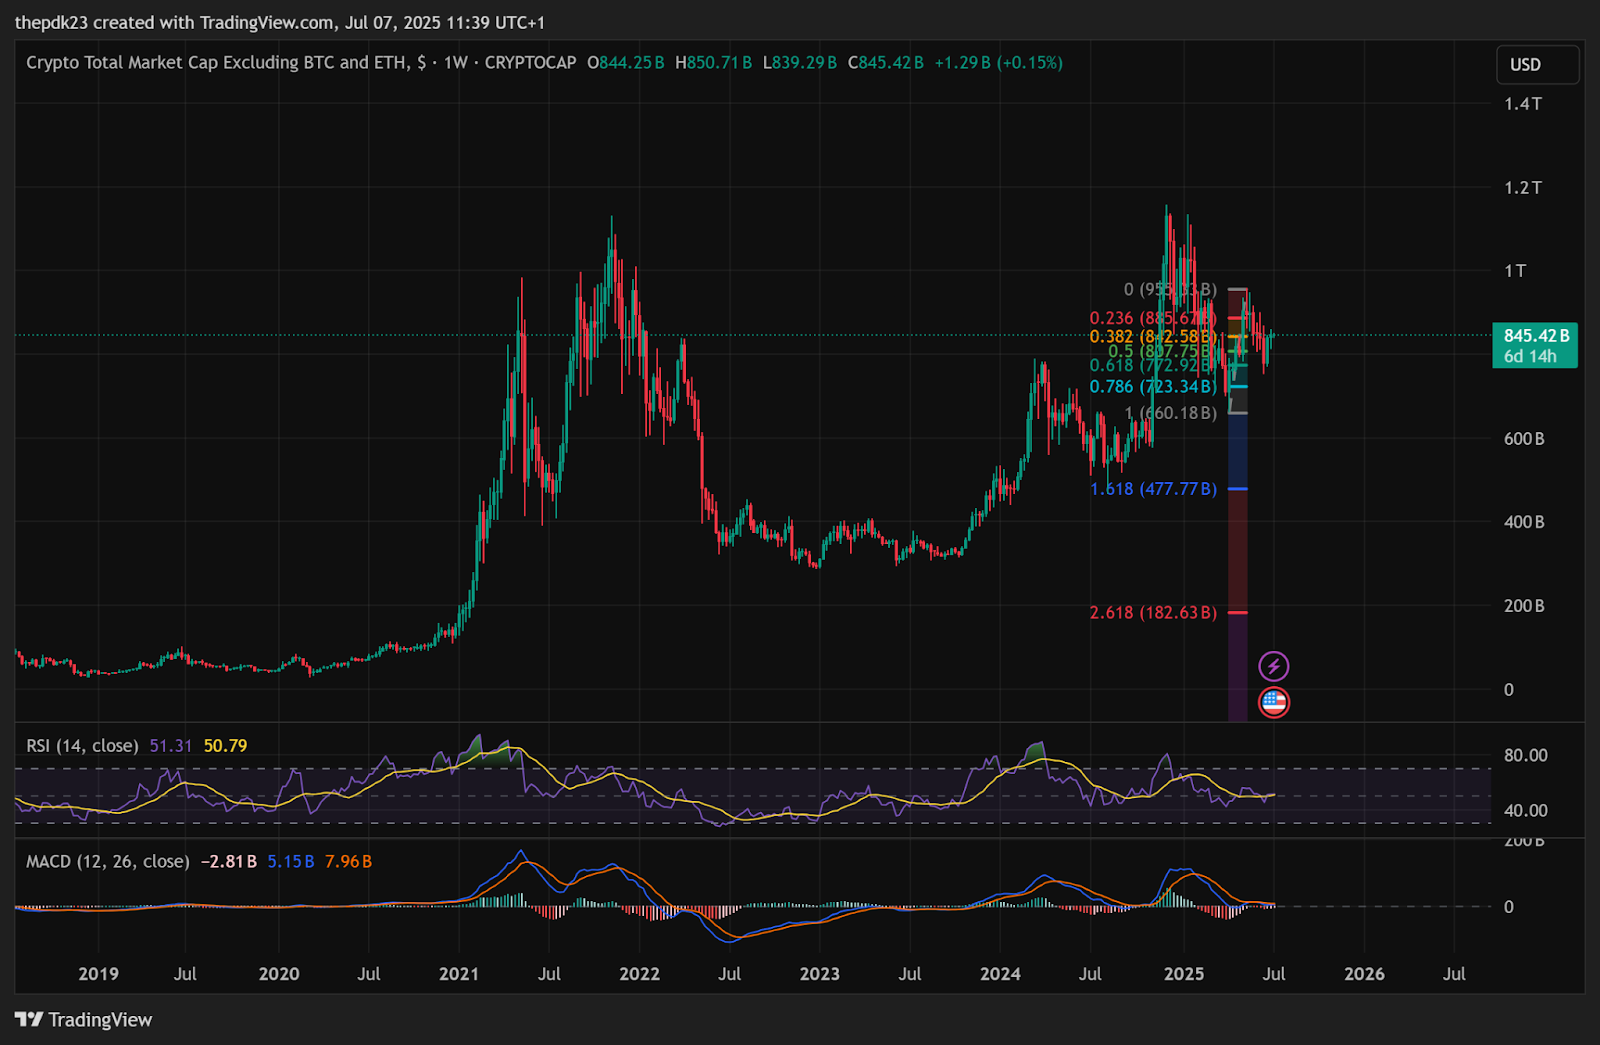
TOTAL3 Weekly Chart with RSI, MACD | Source: TradingView
A key Fibonacci retracement from the swing high near $958 billion down to the recent swing low around $660 billion in the chart above reveals a critical resistance level at 0.236 Fib ($880 billion).
Meanwhile, the 0.382 Fib around $825 billion has held as short-term support while the 0.618 Fib near $922 billion acts as the next major upside target. If bulls can reclaim the 0.236 level, the next target is at 0.618 ($922 billion) and possibly even a retest of $958 billion is likely.
However, a breakdown below $825 billion could push the market toward the 0.786 Fib ($793 billion), with deeper support at the 1.0 Fib retracement ($660 billion).
The TOTAL3 chart confirms consolidation among altcoins rather than collapse. If Ethereum and other altcoins continue to show strength relative to BTC, we may witness a classic altseason rotation in the coming weeks.
Disclaimer: Coinspeaker is committed to providing unbiased and transparent reporting. This article aims to deliver accurate and timely information but should not be taken as financial or investment advice. Since market conditions can change rapidly, we encourage you to verify information on your own and consult with a professional before making any decisions based on this content.

A crypto journalist with over 5 years of experience in the industry, Parth has worked with major media outlets in the crypto and finance world, gathering experience and expertise in the space after surviving bear and bull markets over the years. Parth is also an author of 4 self-published books.


![11 Best Crypto & Bitcoin Casinos in Australia [2025]](https://coincheckup.com/blog/wp-content/uploads/best-crypto-and-bitcoin-casinos-in-australia-coincheckup-1024x576.png)
 English (US) ·