 3 hours ago
3
3 hours ago
3
While ETH remains in a strong uptrend on higher timeframes, the bearish divergences on both daily and 4H RSI suggest caution. A potential correction toward $4.1K should not be ruled out unless buyers manage to defend $4.4K and push the price above the $4.8K ATH with convincing momentum.
Technical Analysis
By Shayan
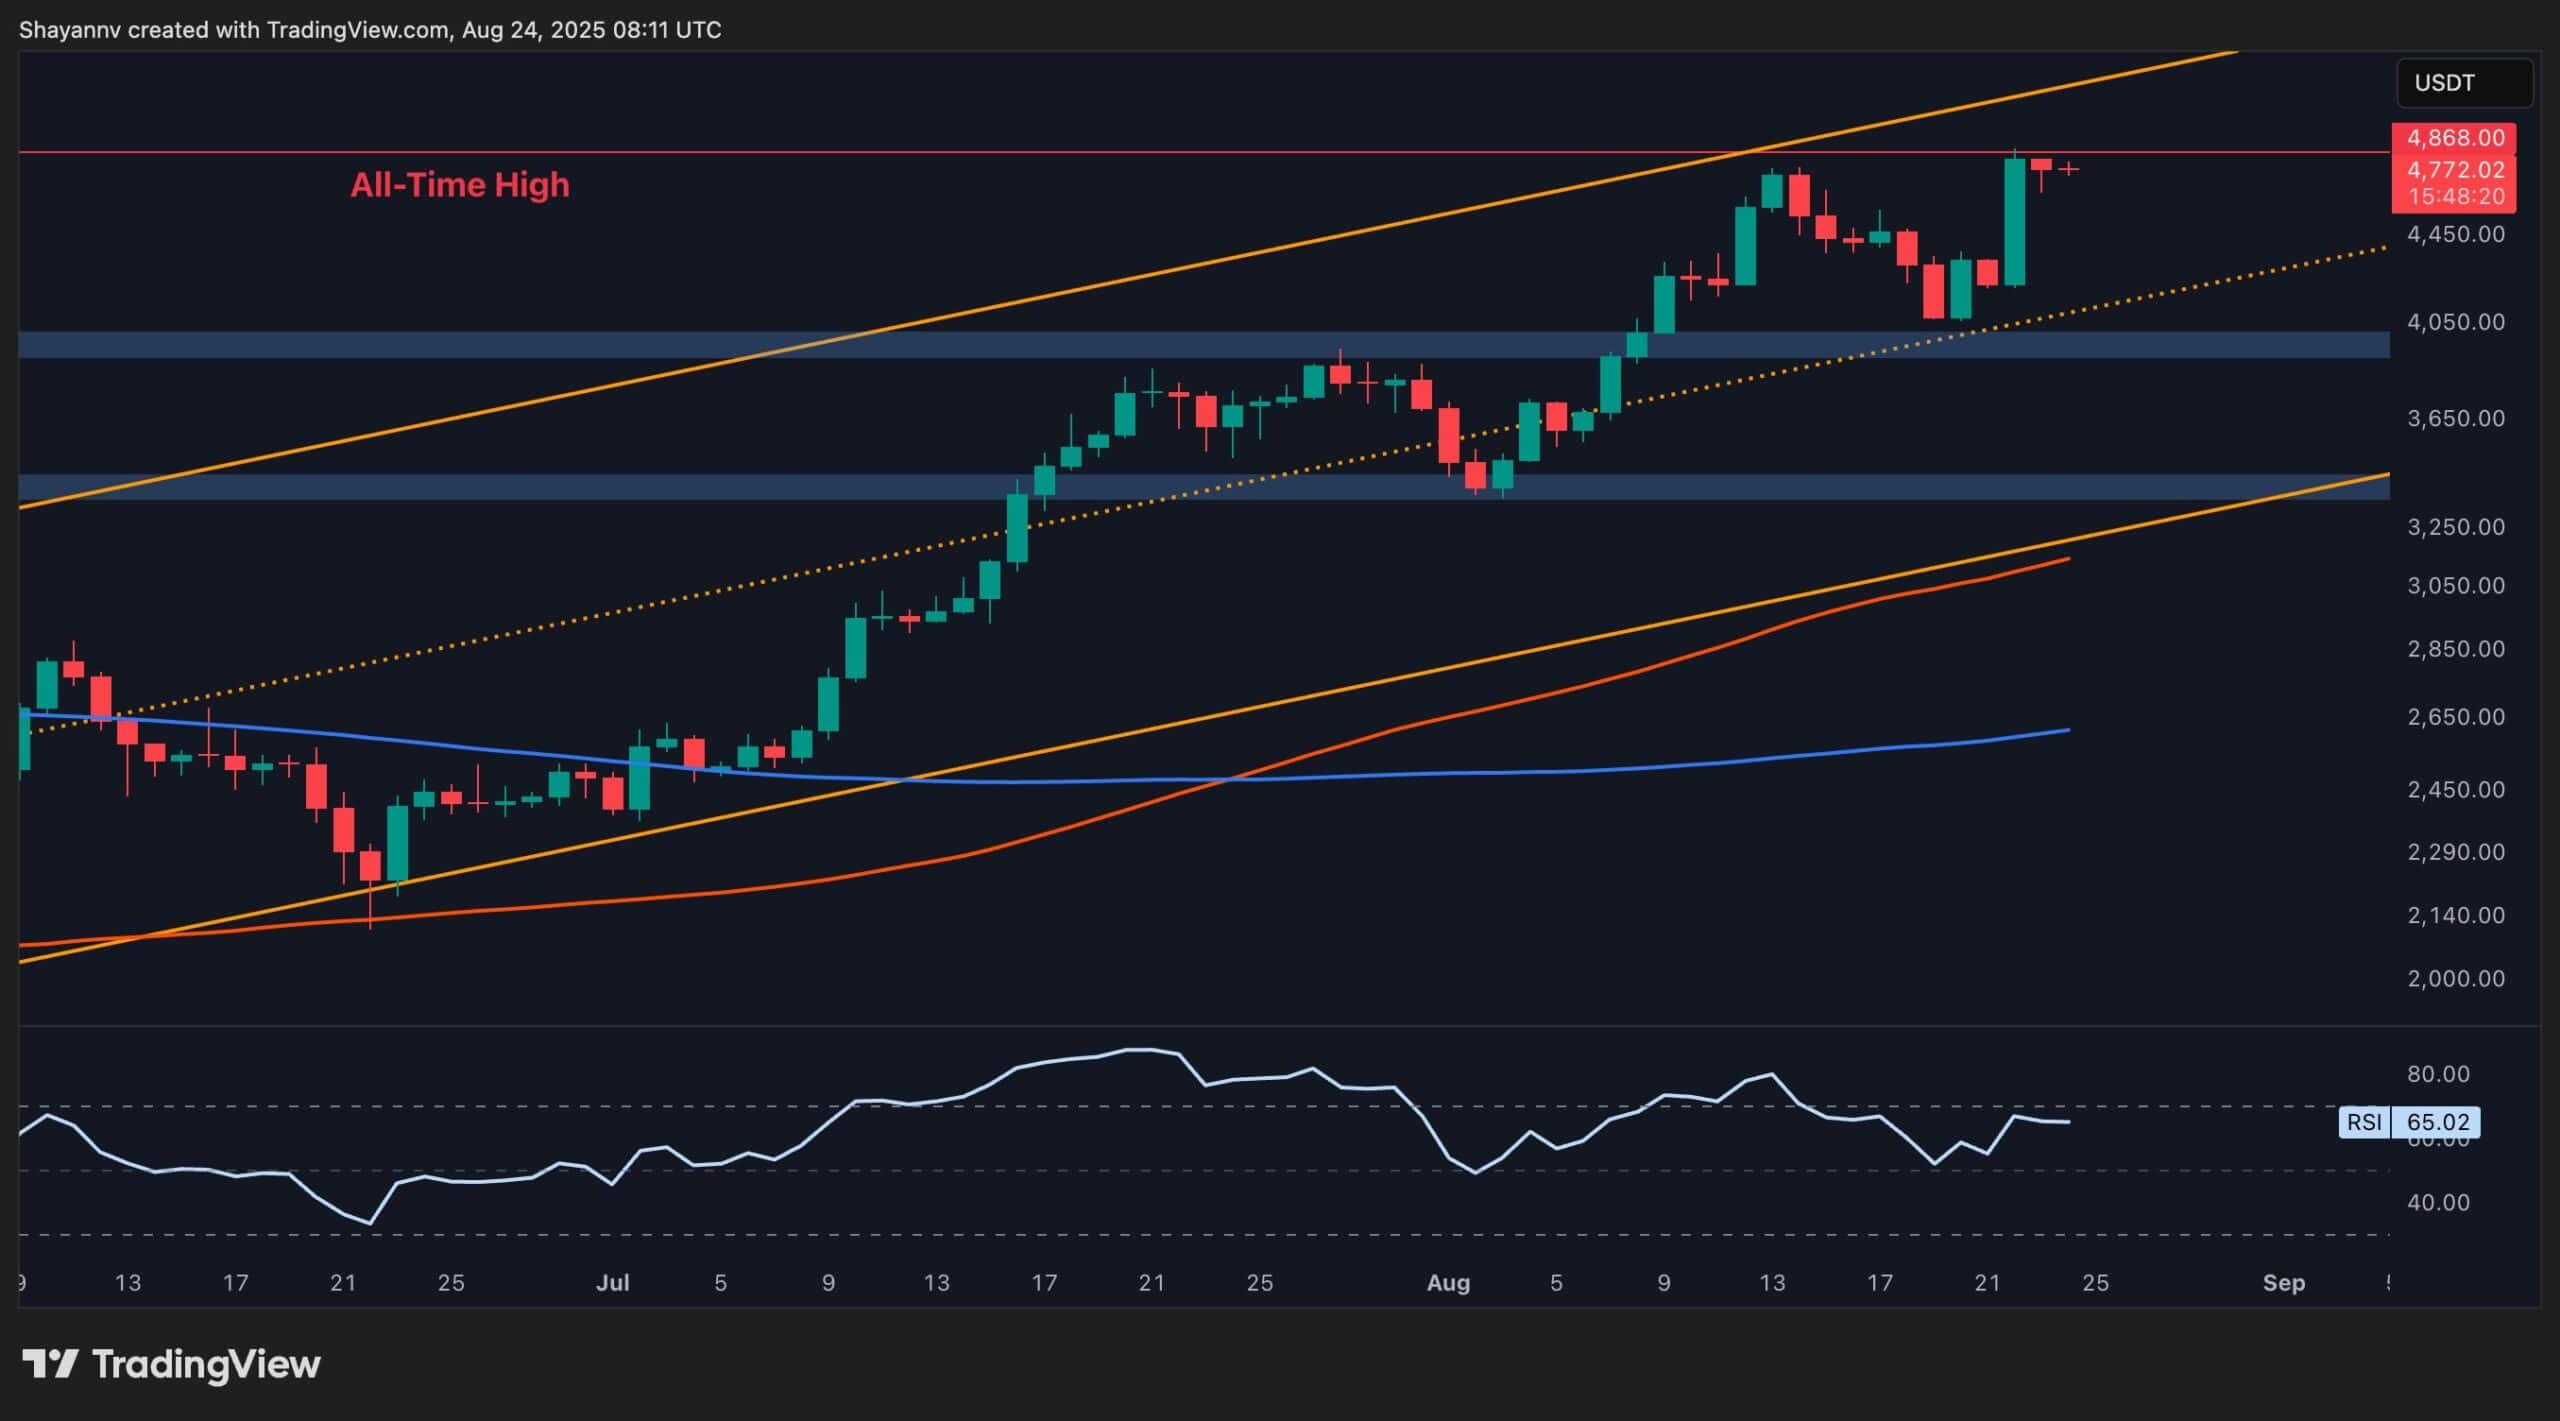
The Daily Chart
On the daily timeframe, Ethereum has formed a slightly higher high at $4,884 compared to its previous peak. However, RSI has failed to make a corresponding higher high, forming a bearish divergence, a classic warning of potential exhaustion in the trend.
The price is currently consolidating just below the new ATH, within the upper boundary of the ascending channel. Immediate support lies at $4,400–$4,450, followed by the Fib retracement cluster at $4,070–$3,900, which aligns with the channel’s midline and remains a high-probability demand zone if a correction deepens.
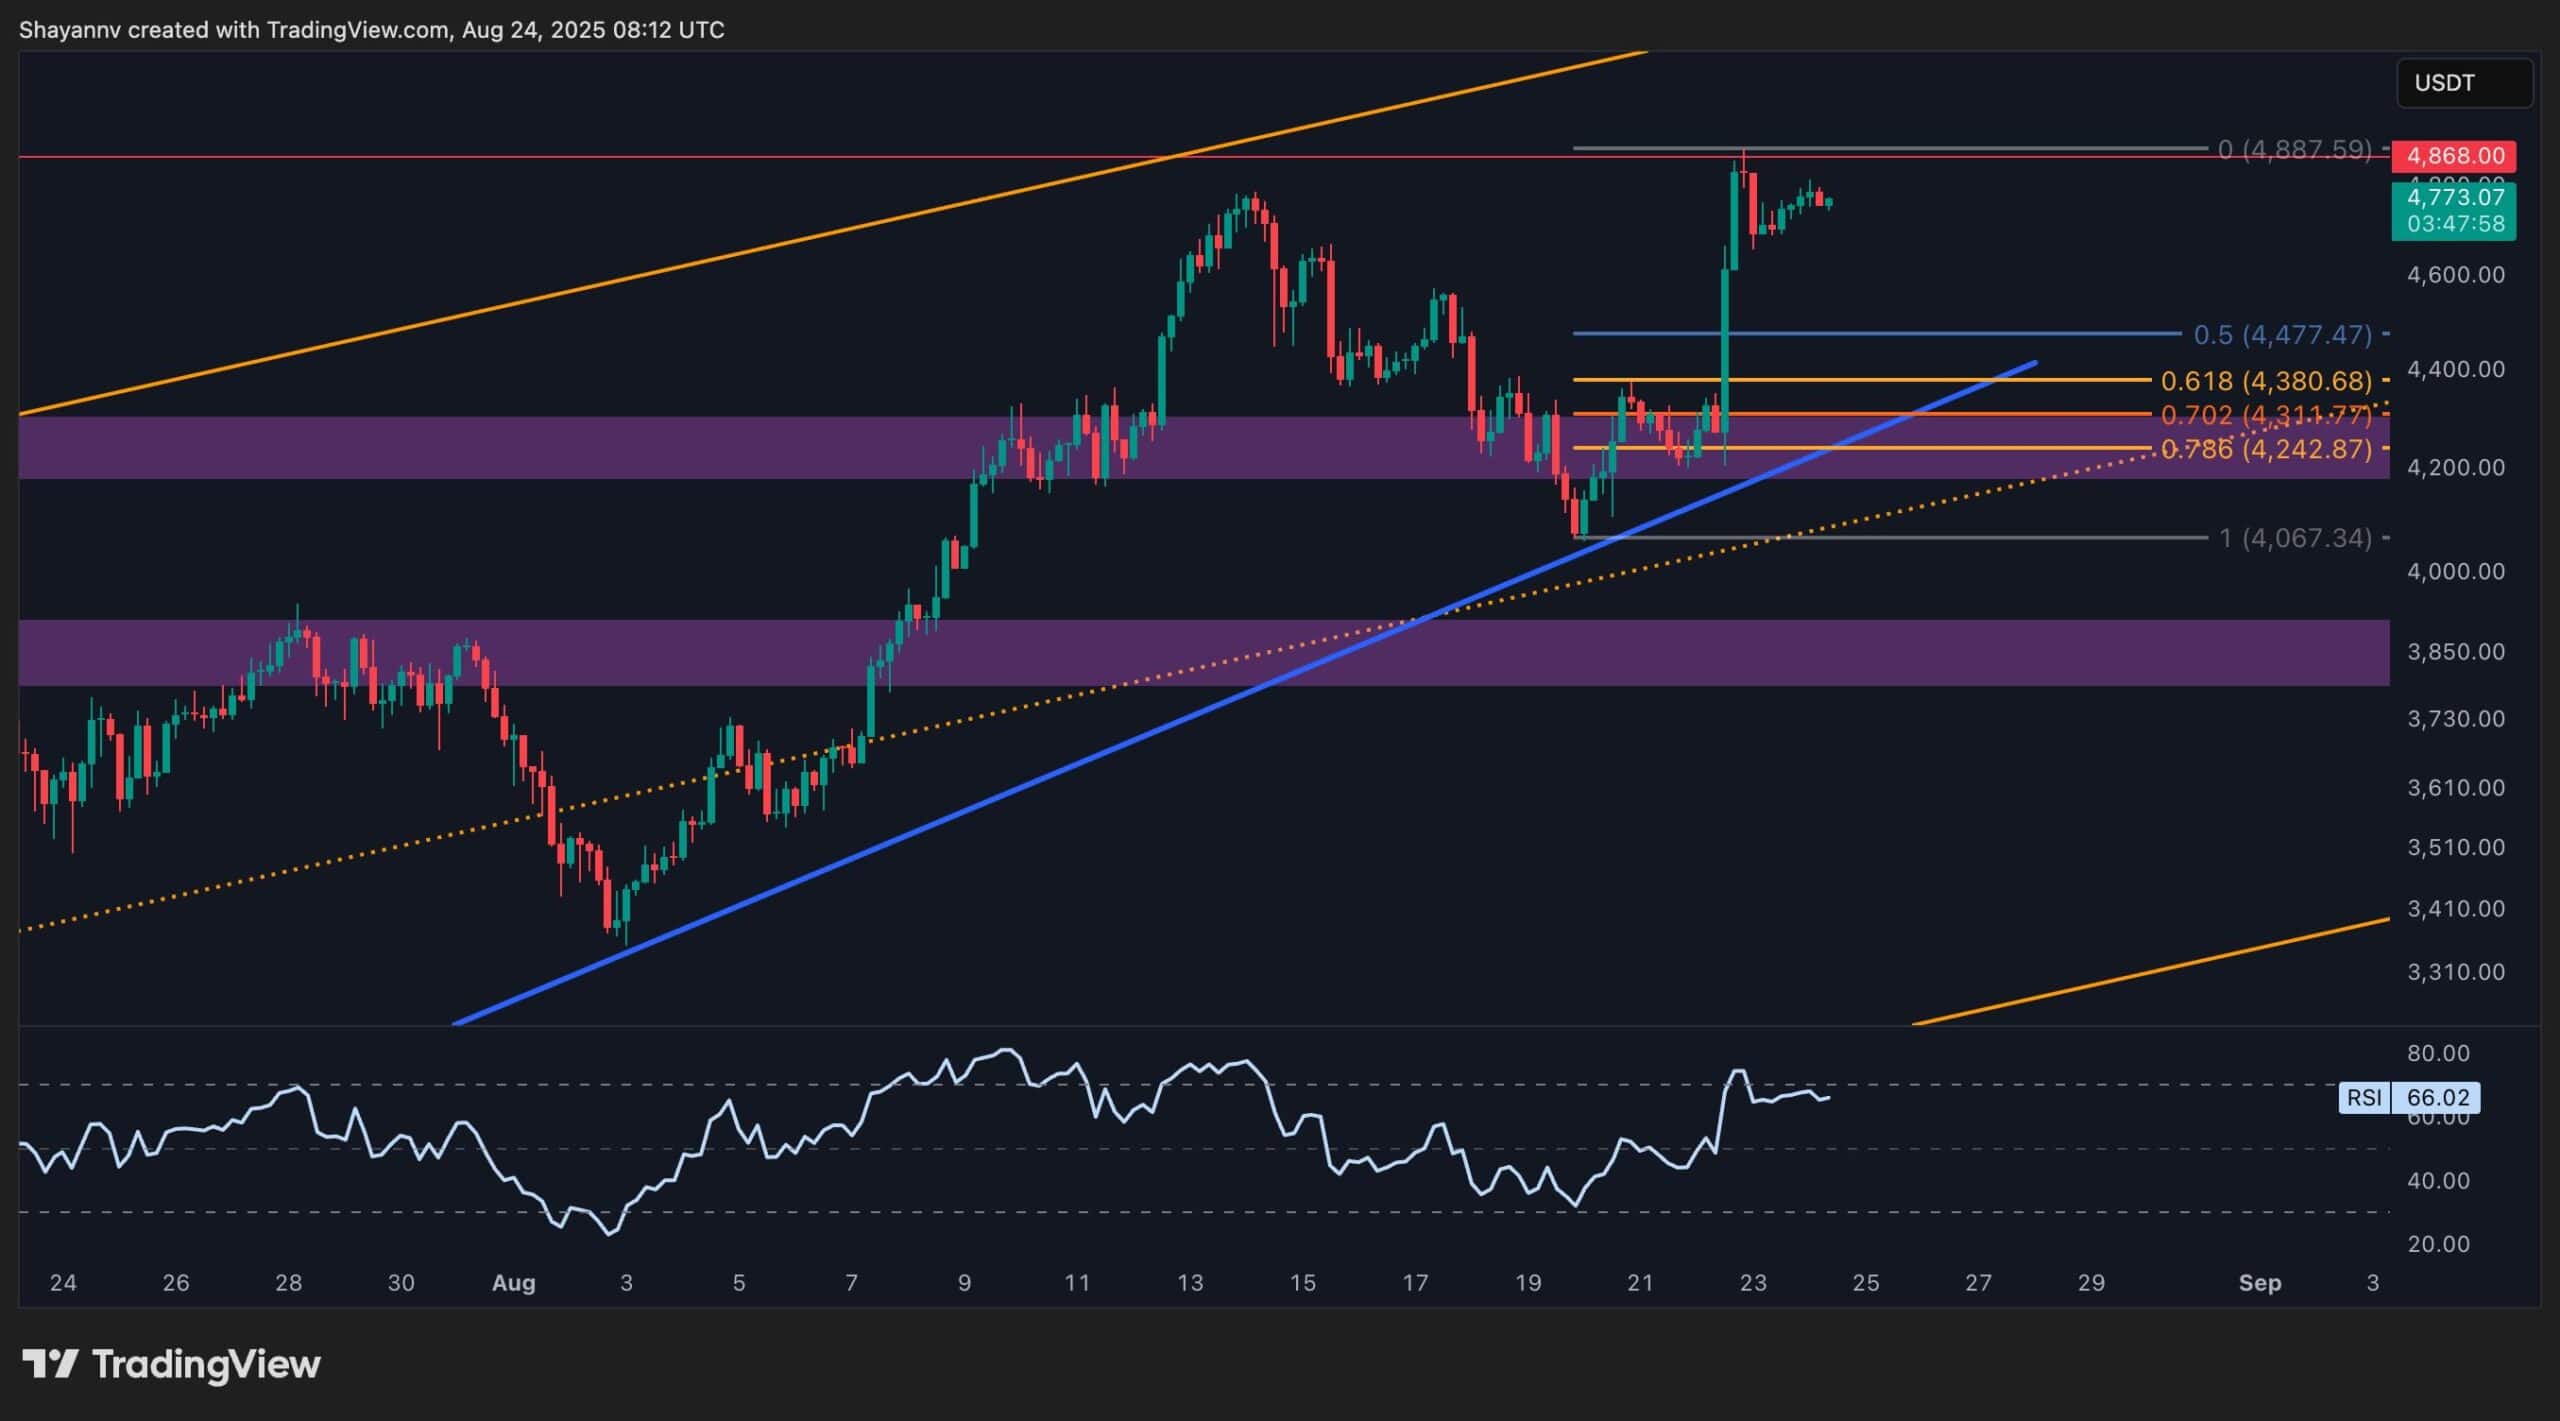
The 4-Hour Chart
The 4-hour chart highlights a sharp liquidity sweep toward $4,884, followed by consolidation. Similar to the daily chart, RSI is showing bearish divergence as the price pushed higher while momentum faded. This indicates that buyers are losing strength despite achieving higher highs.
Key short-term supports sit at $4,477 (0.5 Fib) and $4,380–$4,311 (0.618–0.702 retracements). A breakdown below these levels could accelerate selling toward $4K, confirming a short-term market structure shift. On the upside, ETH needs to reclaim the $4.8K with strong momentum to invalidate the divergence and extend the bullish leg.
Onchain Analysis
By Shayan
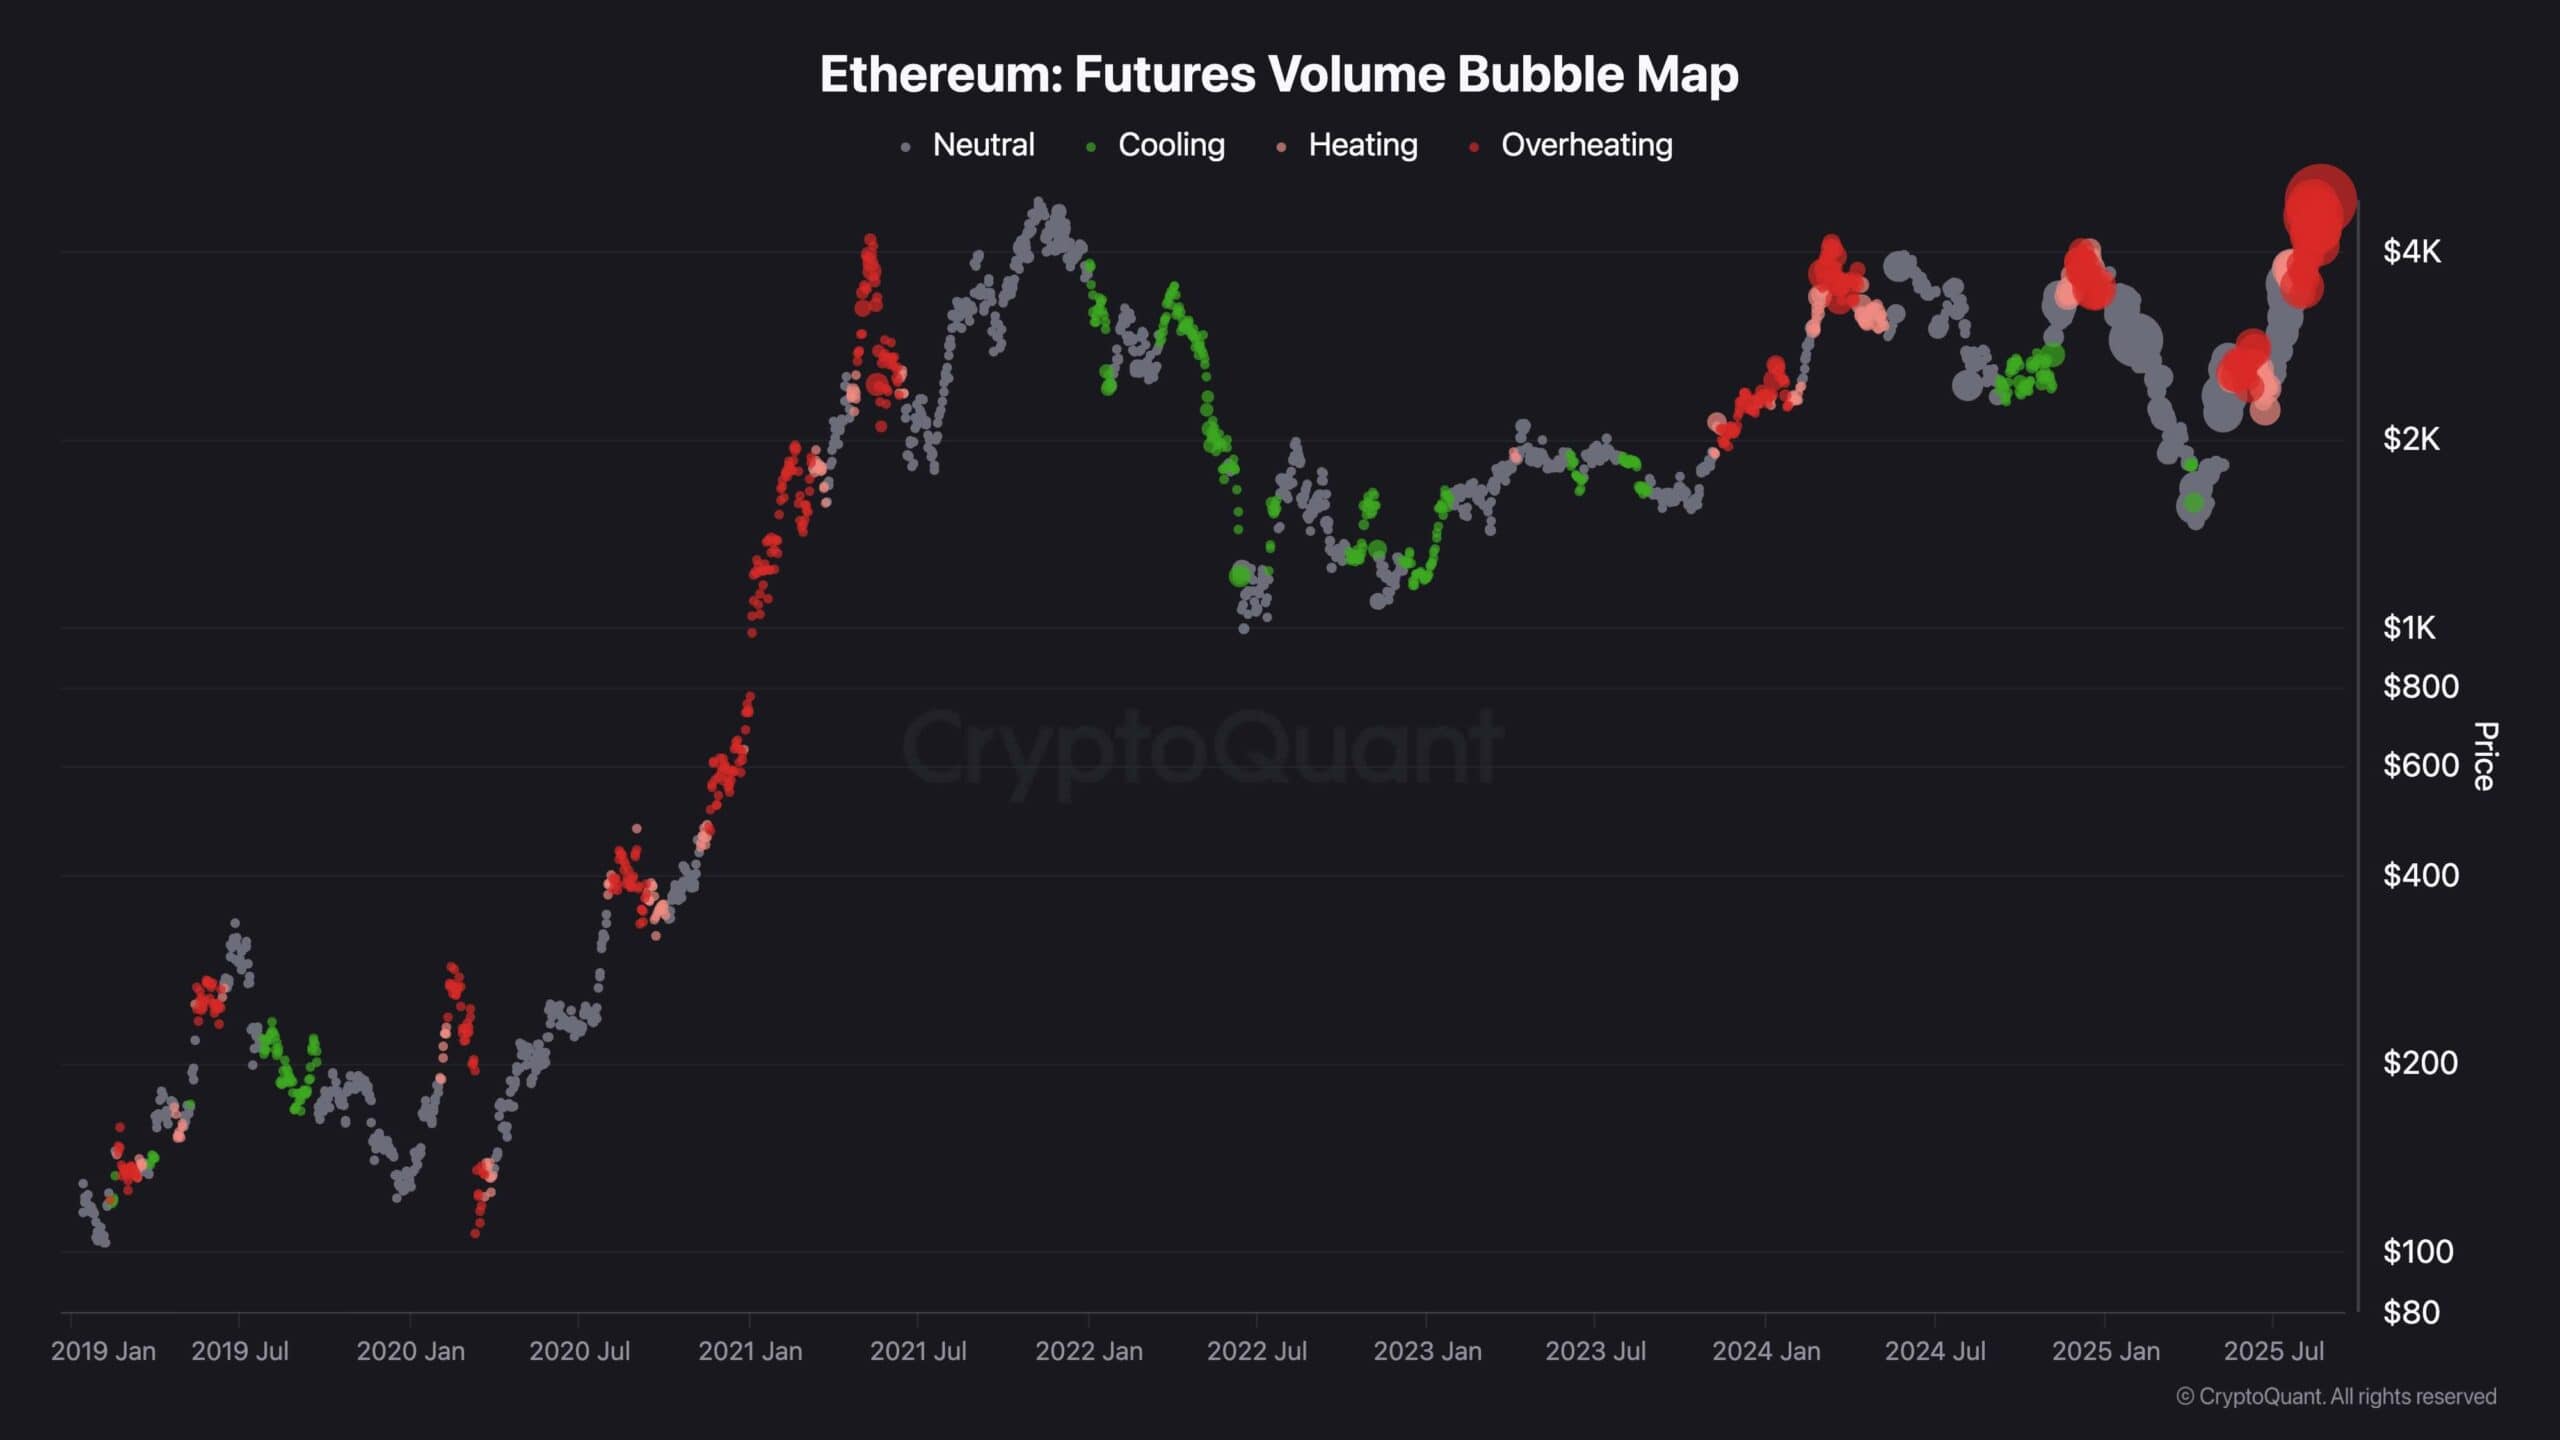
Ethereum has recently revisited its all-time high levels near $4,800–$4,900, with futures trading activity surging in parallel. The Futures Volume Bubble Map provides insight into how derivatives markets are behaving, offering a valuable gauge of whether speculative activity is cooling or overheating. This tool is crucial for assessing market risk and identifying potential reversal or continuation points.
The latest data shows that as ETH rallied toward its highs, futures volume expanded sharply, with multiple red bubbles (overheating) appearing on the map. Historically, such conditions have often coincided with local tops or periods of heavy volatility, as rising leverage increases the risk of liquidation cascades.
Looking back, similar overheating phases in early and late 2021 preceded significant corrections after Ethereum topped. By contrast, green phases (cooling) have typically marked accumulation zones, where leverage resets and ETH is prepared for a fresh leg higher.
At present, ETH futures suggest a stretched derivatives market, with speculative activity reaching overheated levels near ATH. This aligns with the bearish RSI divergences observed on the spot charts, which point to weakening momentum despite higher prices. While an unexpected surge toward a new ATH remains possible under these conditions, the setup signals increased short-term risk of volatility and corrective moves.
Binance Free $600 (CryptoPotato Exclusive): Use this link to register a new account and receive $600 exclusive welcome offer on Binance (full details).
LIMITED OFFER for CryptoPotato readers at Bybit: Use this link to register and open a $500 FREE position on any coin!
Disclaimer: Information found on CryptoPotato is those of writers quoted. It does not represent the opinions of CryptoPotato on whether to buy, sell, or hold any investments. You are advised to conduct your own research before making any investment decisions. Use provided information at your own risk. See Disclaimer for more information.
Cryptocurrency charts by TradingView.


 English (US) ·