 1 month ago
27
1 month ago
27
Ethereum has entered a decisive bearish phase after losing multiple high-timeframe support levels in a matter of days. The latest sell-off pushed ETH through a major confluence zone that had previously acted as support throughout the first half of the year, placing the market at a critical juncture where buyers must defend lower demand levels to prevent a deeper correction.
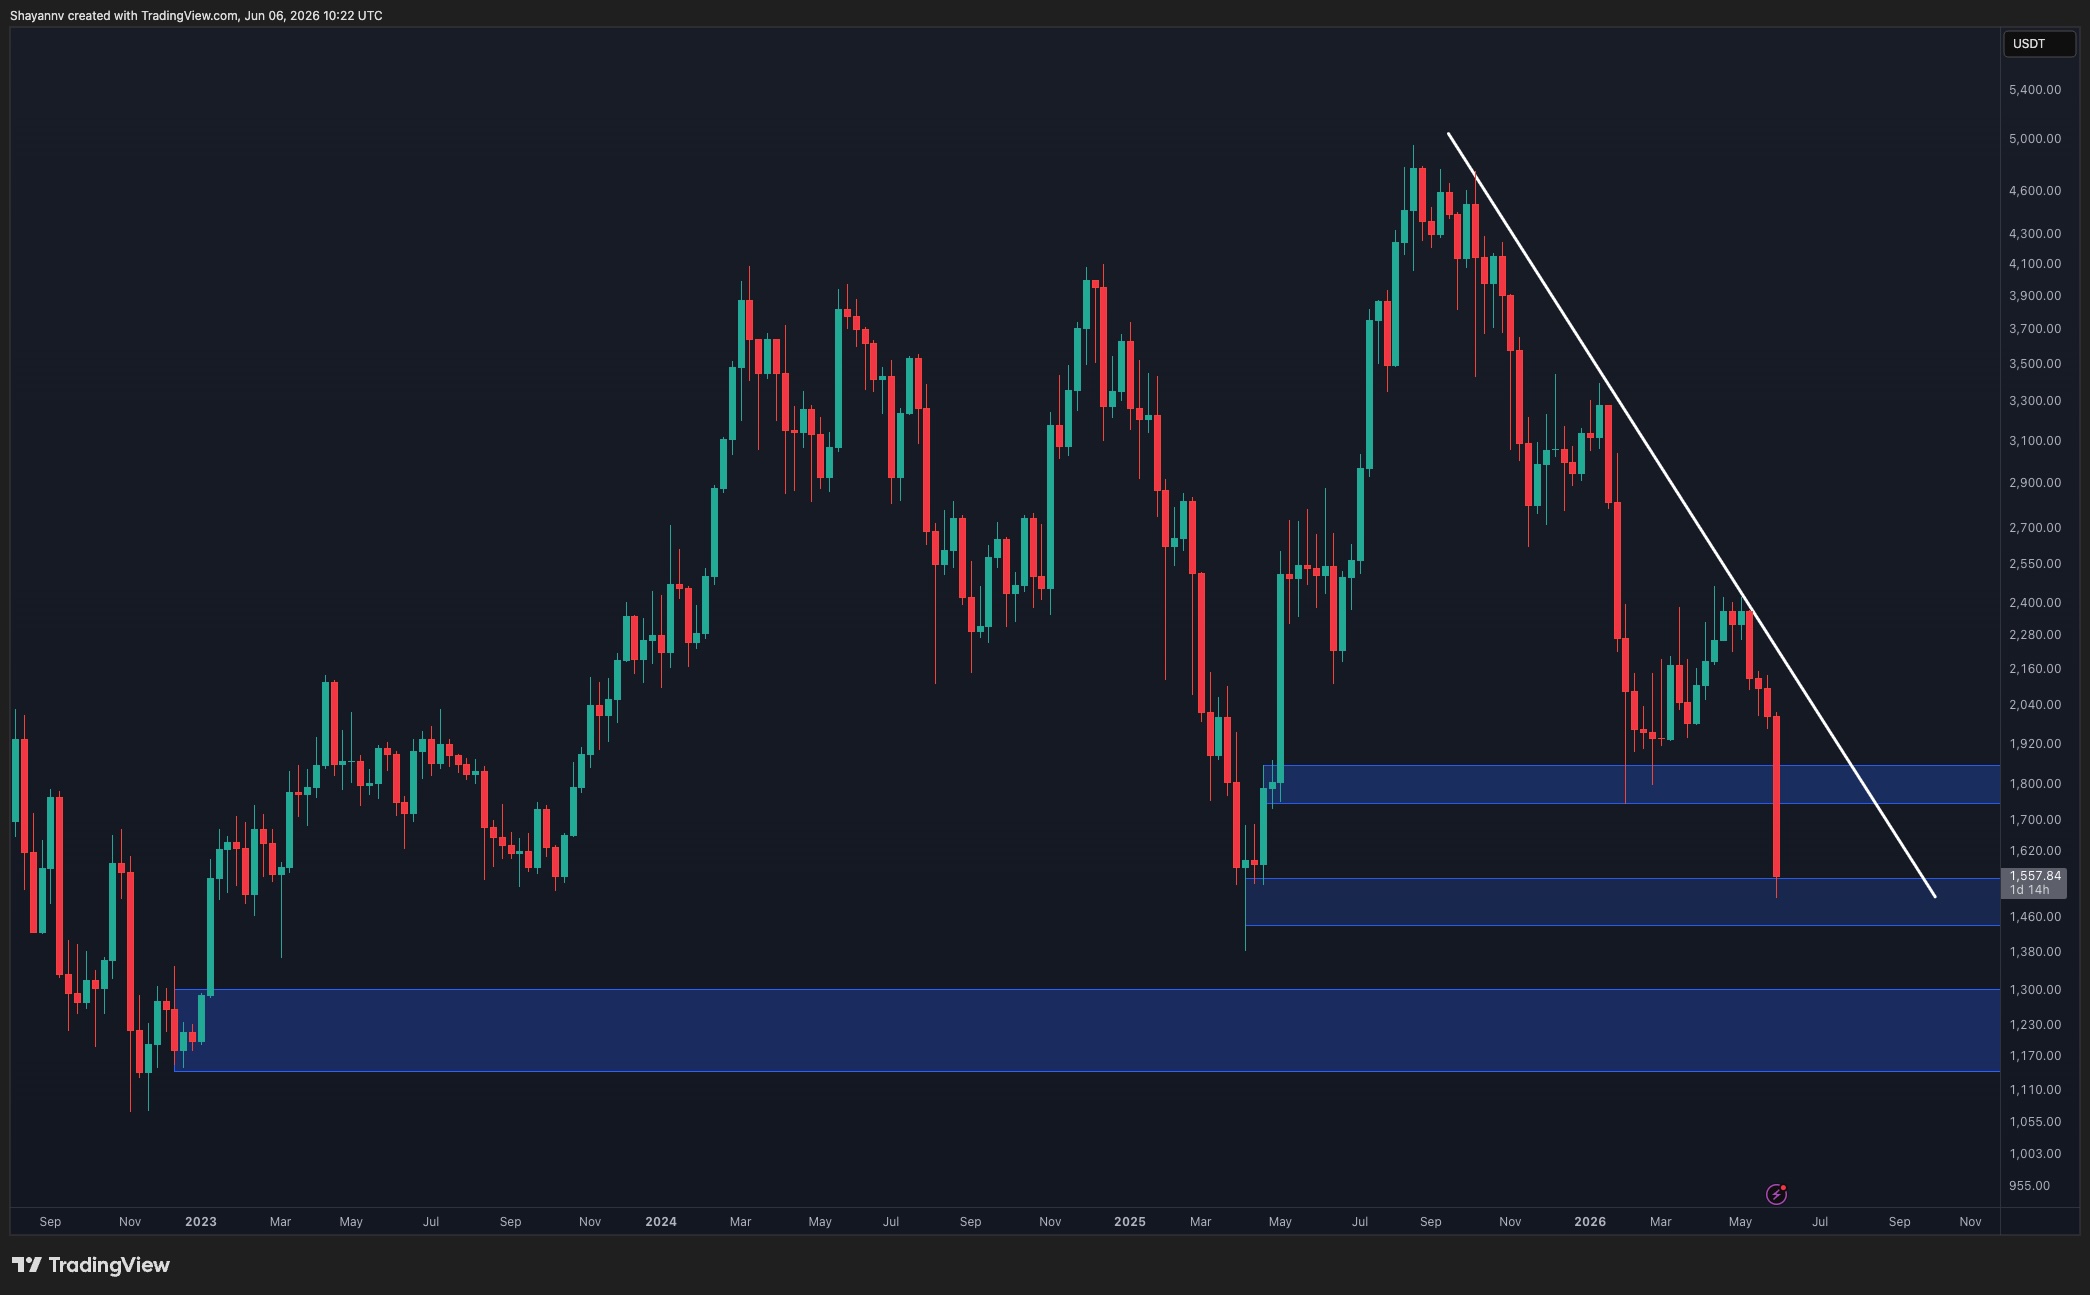
Ethereum Price Analysis: The Weekly Chart
The weekly chart shows a significant deterioration in market structure. After peaking near $5K, ETH established a series of lower highs beneath a descending trendline that has capped every major recovery attempt since late 2025. The recent rejection from this trendline reinforced bearish control and accelerated the latest downside move.
More importantly, ETH has now broken below the major support area around $1.75K-$1.85K, a zone that previously acted as a key pivot during the March rebound. The breakdown confirms a bearish continuation pattern and shifts focus toward the next demand region around $1.45K-$1.55K.
The current weekly candle is testing the upper boundary of that support zone, with price trading near $1.56K. A weekly close below this region would significantly increase the probability of an extension toward the broader demand area around $1.15K-$1.30K, which represents the next major historical support visible on the chart.
For bulls to regain momentum, ETH would first need to reclaim the broken $1.75K-$1.85K region and eventually break above the descending trendline resistance. Until then, the broader structure remains bearish.
ETH/USDT 4-Hour Chart
The 4-hour chart highlights the severity of the recent sell-off. ETH broke down from a prolonged descending structure without establishing any meaningful support. The blue support zone between roughly $1.74K and $1.85K, which had previously acted as a major demand area and also aligns with the 0.5-0.618 Fib levels, failed to contain selling pressure and has now turned into resistance.
ETH is currently testing the lower demand zone around $1.50K-$1.57K, where some reactive buying has emerged. However, the rebound remains limited and does not yet indicate a sustainable trend reversal. If this support area fails to hold, the next downside objective could emerge below $1.50K. On the other hand, any relief rally would likely encounter resistance around $1.74K-$1.85K, followed by the Fibonacci cluster between $1.88K and $1.92K.

Sentiment Analysis
The 3-month liquidation heatmap suggests that a substantial amount of downside liquidity has already been cleared during the latest cascade lower. As ETH plunged from above $2K toward $1.5K, most of the notable liquidation clusters beneath the market were swept, reducing the immediate magnetic effect from lower levels.
Meanwhile, the most significant remaining liquidity concentrations are now positioned above the current price, particularly in the $1.7K-$1.9K region and extending toward the $2.4K-$2.5K area. This creates an interesting dynamic where the market lacks major nearby liquidity targets below spot while maintaining sizeable overhead liquidation pools.
However, the absence of significant liquidity beneath price does not necessarily imply an immediate reversal. Instead, it suggests that ETH may enter a period of consolidation or corrective rebound before establishing its next directional move. If buyers fail to reclaim broken support levels, the market could still experience a deeper retracement driven by spot selling rather than liquidation hunting.
For now, Ethereum remains under strong bearish pressure, but with most nearby downside liquidity already swept, traders should closely monitor whether the $1.45K-$1.55K support zone can stabilise price and trigger a relief recovery toward the newly formed resistance overhead.

Binance Free $600 (CryptoPotato Exclusive): Use this link to register a new account and receive $600 exclusive welcome offer on Binance (full details).
LIMITED OFFER for CryptoPotato readers at Bybit: Use this link to register and open a $500 FREE position on any coin!
Disclaimer: Information found on CryptoPotato is those of writers quoted. It does not represent the opinions of CryptoPotato on whether to buy, sell, or hold any investments. You are advised to conduct your own research before making any investment decisions. Use provided information at your own risk. See Disclaimer for more information.


 English (US) ·