 1 month ago
32
1 month ago
32
Ethereum price started a recovery wave from the $2,025 zone. ETH is now consolidating above $2,120 and might struggle to clear the $2,200 resistance.
- Ethereum started a recovery wave above the $2,120 zone.
- The price is trading above $2,120 and the 100-hourly Simple Moving Average.
- There is still a key bearish trend line active with resistance at $2,165 on the hourly chart of ETH/USD (data feed via Kraken).
- The pair could start a fresh decline if it stays below the $2,165 resistance.
Ethereum Price Faces Resistance
Ethereum price managed to stay above $2,000 and started a recovery wave, like Bitcoin. ETH price was able to climb above the $2,080 and $2,120 resistance levels.
The price cleared the 38.2% Fib retracement level of the downward move from the $2,385 swing high to the $2,025 low. More importantly, there was a break above one of the two bearish trend lines with resistance at $2,120 on the hourly chart of ETH/USD.
Ethereum price is now trading above $2,100 and the 100-hourly Simple Moving Average. However, the bears are active near $2,180. Besides, there is still a key bearish trend line active with resistance at $2,165.
If the bulls remain in action above $2,065, the price could attempt another increase. Immediate resistance is seen near the $2,165 level. The first key resistance is near the $2,200 level. The next major resistance is near the $2,250 level. A clear move above the $2,250 resistance might send the price toward the $2,300 resistance or the 76.4% Fib retracement level of the downward move from the $2,385 swing high to the $2,025 low.
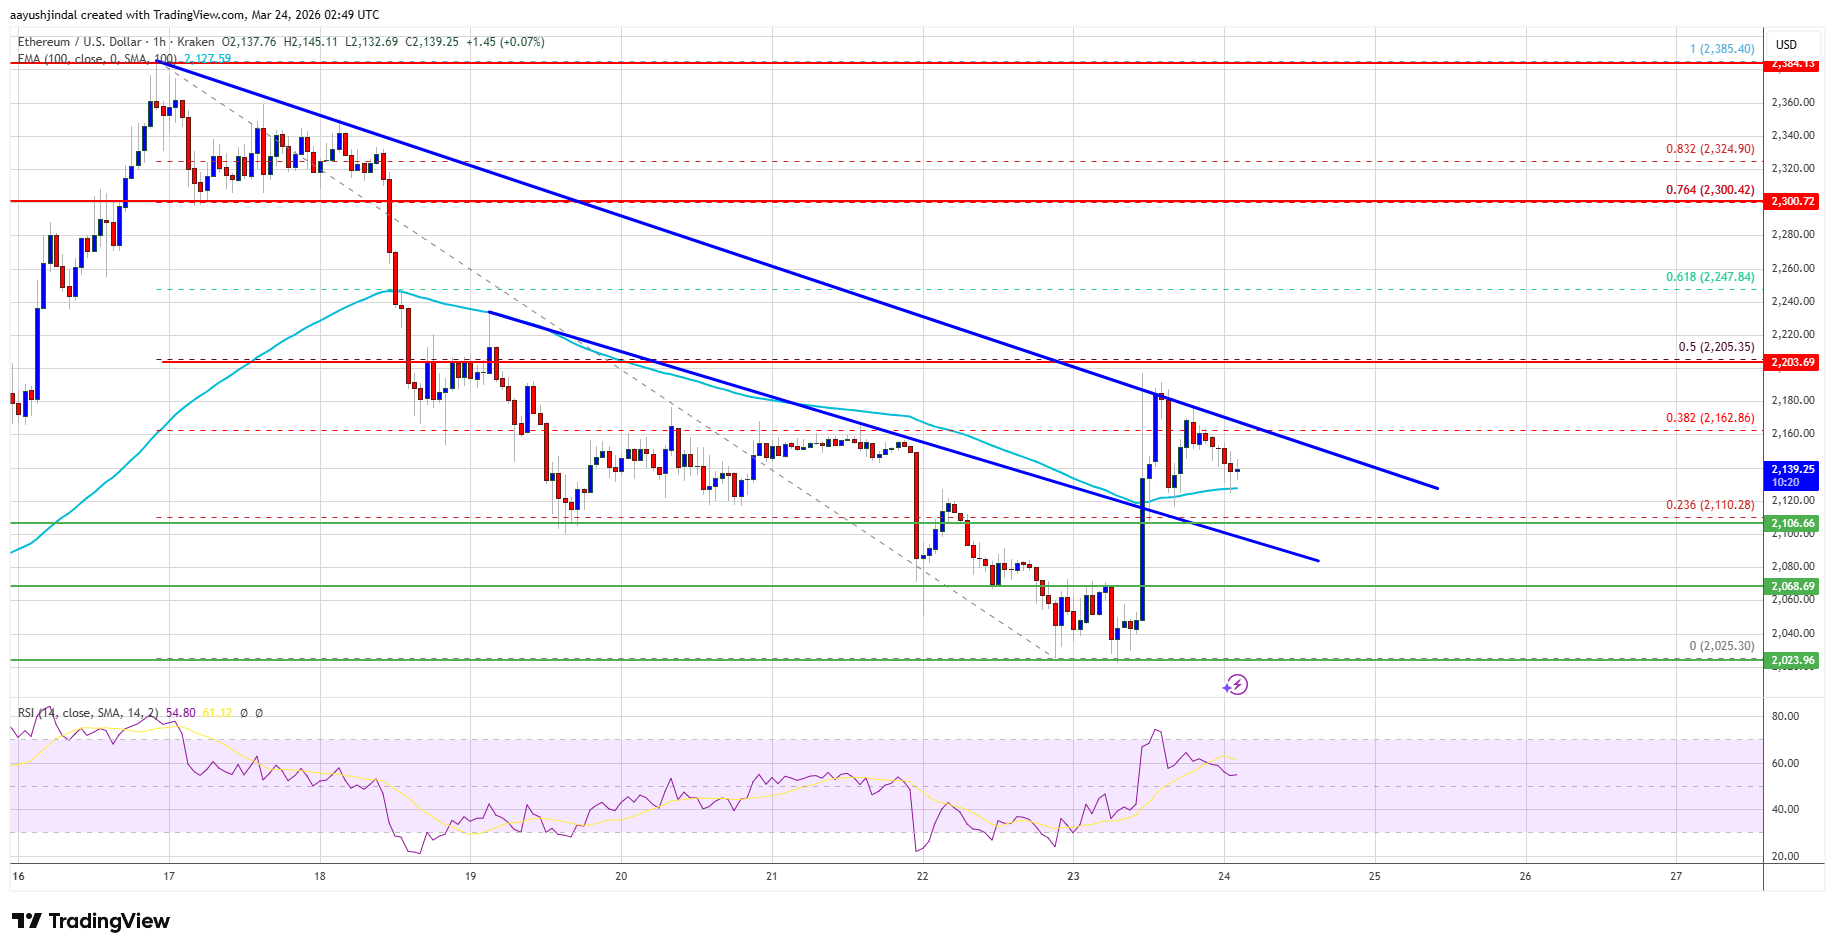 Source: ETHUSD on TradingView.com
An upside break above the $2,300 region might call for more gains in the coming days. In the stated case, Ether could rise toward the $2,350 resistance zone or even $2,400 in the near term.
Another Decline In ETH?
If Ethereum fails to clear the $2,165 resistance, it could start a fresh decline. Initial support on the downside is near the $2,120 level. The first major support sits near the $2,065 zone.
A clear move below the $2,065 support might push the price toward the $2,025 support. Any more losses might send the price toward the $2,000 region. The main support could be $1,940.
Technical Indicators
Hourly MACD – The MACD for ETH/USD is losing momentum in the bullish zone.
Hourly RSI – The RSI for ETH/USD is now above the 50 zone.
Major Support Level – $2,065
Major Resistance Level – $2,165


 English (US) ·