 5 hours ago
2
5 hours ago
2
Ethereum price is making headlines again, climbing aggressively as it approaches the key psychological barrier of $4,000. After weeks of consolidation, ETH has erupted with a powerful breakout, leaving behind major resistance zones and signaling renewed bullish momentum. On the daily chart, ETH price has been printing strong Heikin Ashi candles backed by rising volume and an overheated RSI—indicating that the bulls are in full control, at least for now.
But is this breakout sustainable, or are we witnessing the final leg of an overextended rally? In this article, we’ll analyze Ethereum’s price structure, momentum indicators, Fibonacci targets, and likely next moves to determine whether ETH price can truly break the $4K mark—or if a correction is looming.
Ethereum Price Prediction: Why Is Ethereum Price Surging Right Now?
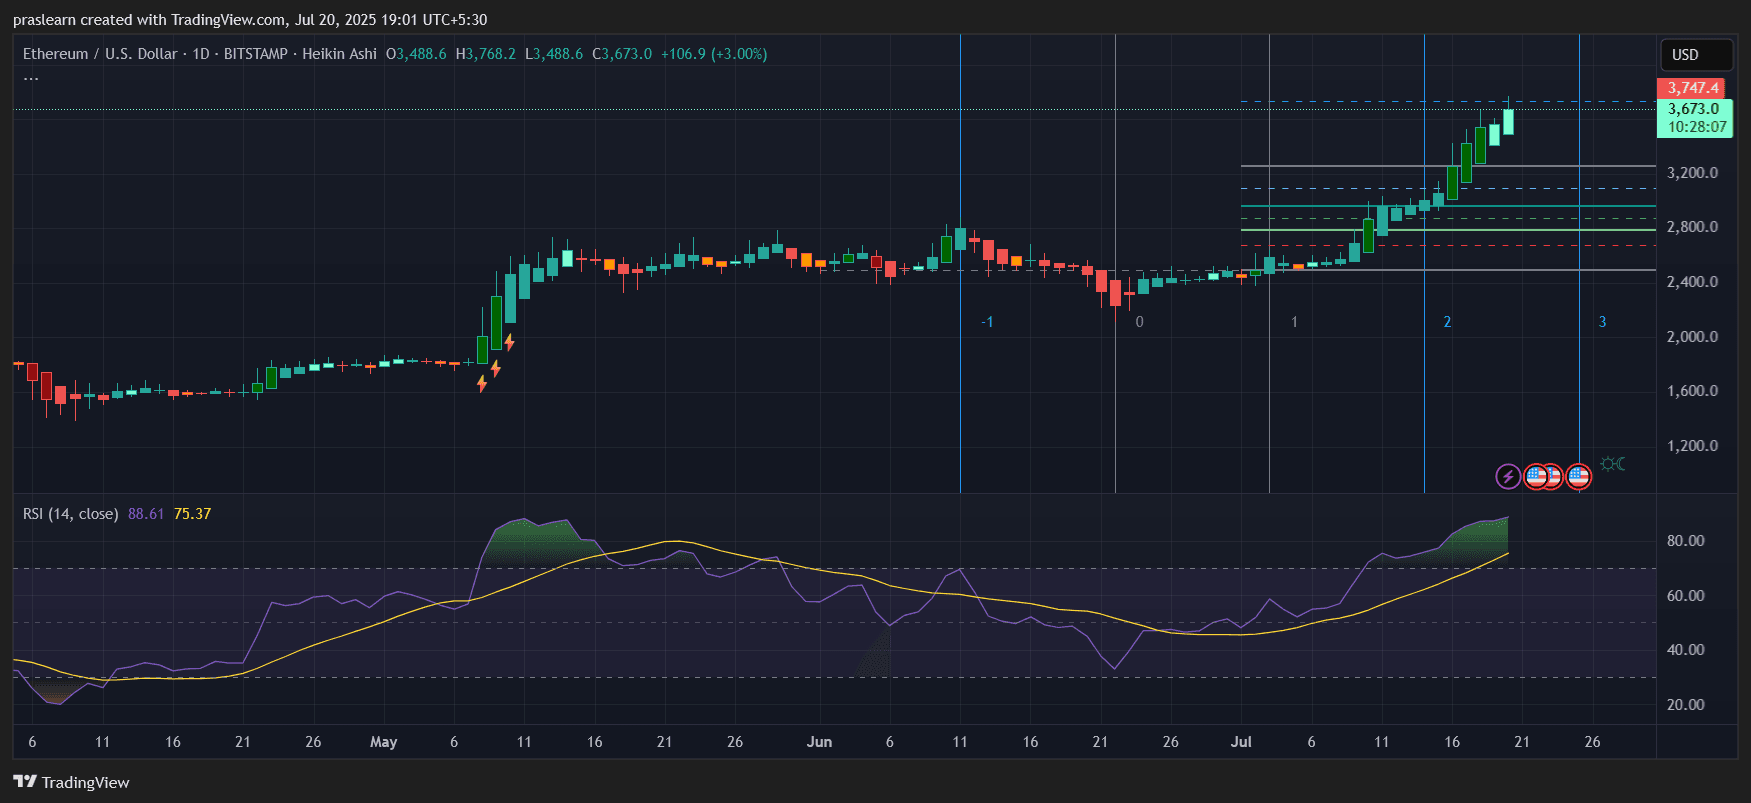 ETH/USD Daily Chart- TradingView
Ethereum (ETH) price is currently on fire, with its price climbing to $3,673—up 3.00% in the last daily candle. The daily chart (Heikin Ashi) shows a strong and consistent bullish trend, with multiple consecutive green candles and minimal wicks to the downside. Momentum has clearly shifted, and Ethereum is challenging key resistance levels near $3,747.4.
The major catalyst seems to be the broader market optimism following renewed ETF speculation and a surge in DeFi activity. However, the chart shows this isn’t just hype—it’s a technically strong move with confirmation from indicators.
What Does the RSI Say About Ethereum’s Strength?
The Relative Strength Index (RSI) is currently at 88.61, well above the traditional overbought threshold of 70. This extreme reading is rare and signals tremendous momentum—but also a potential short-term cooling.
Historically, when Ethereum’s RSI reaches these levels, a pullback or consolidation follows within 5–7 days. However, overbought conditions during strong breakouts often lead to bullish continuations if volume supports the trend.
Here’s a historical context:
In May 2021, ETH's RSI reached 88, followed by a 10% rise before a 15% correction.
A similar setup now suggests Ethereum could hit $3,950–$4,000 before facing resistance.
Fibonacci Levels and Breakout Zones
Looking at the Fibonacci retracement levels drawn from the previous swing high and low, Ethereum has broken past multiple retracement zones:
- $2,800 – Previous 0.618 level broken with high volume
- $3,200 – Passed without resistance
- $3,488 – Local breakout level
- $3,747.4 – Next key target zone
If Ethereum price breaks above $3,750, the next Fibonacci extension target sits at $4,150, which aligns with the psychological round number of $4,000.
Price Projection Calculation:
Let’s use a simple Fibonacci extension method:
If the swing low was $2,400 and swing high is $3,488, the difference is:
$3,488 - $2,400 = $1,088
Fibonacci 1.618 extension = $2,400 + (1.618 × $1,088) = $4,162
This projection points toward a possible $4,150–$4,200 target in the coming weeks.
Is This a Blow-Off Top or the Start of a New Rally?
Currently, Ethereum price is trading in Wave 3 of an Elliott Wave pattern, which typically represents the strongest bullish leg. The chart shows clear impulsive movement without significant retracement, confirming bullish control.
The lack of bearish divergence on the RSI and the strength of the current candles support the case for a continuation rally, at least until $3,950–$4,150.
However, traders should note:
- ETH is overbought
- Pullbacks to $3,200 or $2,950 are possible
- Strong support lies between $2,850–$3,200
Ethereum Price Prediction for July 2025
Given current momentum, strong Heikin Ashi structure, and RSI-backed breakout, Ethereum price is likely to continue its upward journey.
Short-Term Prediction (Next 7–10 days):
- Bullish scenario: ETH hits $3,950–$4,150
- Consolidation scenario: ETH stabilizes between $3,200–$3,600
- Bearish reversal only if: ETH drops below $2,950
Should You Buy ETH Now?
The technicals support a bullish continuation. However, with RSI so high, short-term pullbacks are natural and even healthy. If you're looking to enter, consider waiting for a dip near the $3,200 zone—or ride the wave with a tight stop loss.
Ethereum price looks strong, and the chart setup could be signaling the start of a major bullish phase. If it breaks $3,750 convincingly, $4,150 may just be the next destination.
Looking to Buy ETH? Try OKX
OKX is a top choice to buy ETH. With low trading fees, extensive token listings, and an intuitive interface, it’s a preferred platform for many crypto traders across Europe.
Special Promotion – Limited Time
Until September 14, 2025, OKX is hosting an exclusive McLaren F1 Team giveaway:
--> Receive a complimentary McLaren F1 Team cap<--
Enter to win a VIP trackside experience in Zandvoort (Aug 29–31)
This offer is open to all new European users who haven’t yet traded on OKX. Don’t wait – claim your reward today!
$ETH, $Ethereum, $ETHPrice, $EthereumPrice


 English (US) ·