Ethereum is trading below the $2,700 mark after days of struggling to reclaim it and push above $2,800. Bulls have been unable to gain momentum, and selling pressure has kept ETH below key resistance levels.
On Friday, the market was hit with negative news as Bybit, one of the top crypto exchanges, was hacked, leading to a loss of $1.4 billion in ETH. This event triggered panic selling, driving Ethereum’s price into lower demand levels, adding more uncertainty to its short-term outlook.
However, CryptoQuant data suggests a potential turnaround. Their latest analysis reveals that Ethereum taker buying is showing a bullish divergence—a key indicator that buying pressure is increasing despite price declines. This type of divergence has historically signaled the start of recovery rallies, as traders and institutions accumulate ETH at lower levels in anticipation of a bounce.
With ETH consolidating and bullish signs emerging, the coming days will be crucial in determining whether Ethereum can reclaim the $2,700–$2,800 zone or if further downside is on the horizon. Traders are now watching for key breakout levels to confirm a strong recovery rally.
Ethereum Prepares For A Comeback
Ethereum has been struggling as investors grow increasingly impatient with the massive selling pressure and negative sentiment surrounding the second-largest cryptocurrency. Since late December, ETH has been in a steady decline, with no clear signs of recovery on the horizon. Bulls have failed to reclaim key resistance levels, while bears continue to control the market, pushing the price lower with each failed breakout attempt.
Despite this prolonged bearish trend, on-chain data suggests a potential shift. CryptoQuant shared key data on X, revealing an interesting pattern that has historically marked the end of bearish trends and the beginning of bullish phases.
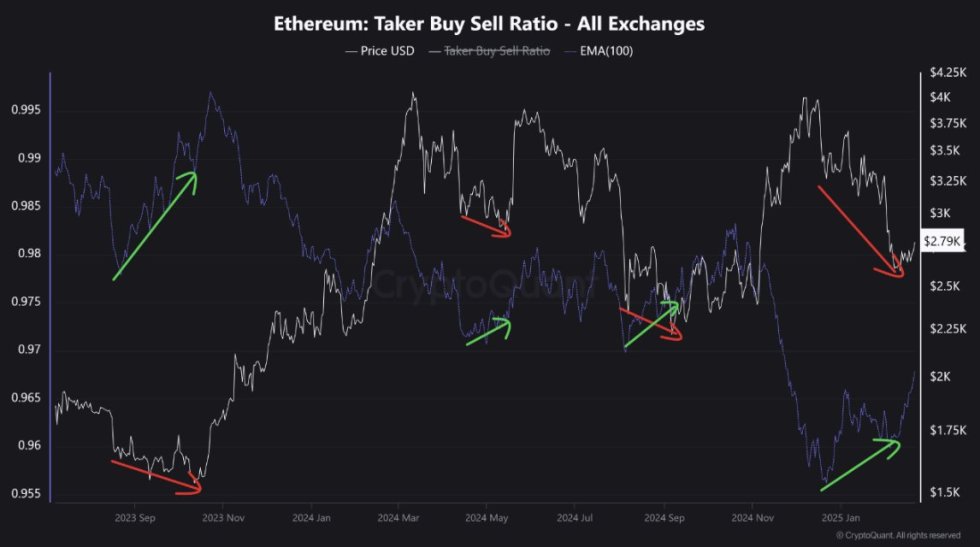 Ethereum Taker Buy Sell Ratio | Source: CryptoQuant on X
According to their analysis, when a bullish divergence occurs—where the price of Ethereum is falling, but taker buying volume is rising—past trends suggest that selling pressure is weakening. This typically signals that buying momentum is building as traders begin accumulating ETH in anticipation of a trend reversal.
Today, Ethereum is showing a taker buying bullish divergence, similar to previous instances that led to bullish breakouts. While the market remains uncertain, this could be an early indication of a new bullish phase. If Ethereum holds above current demand levels and reclaims $2,800, a strong recovery rally could follow.
ETH Testing Short-Term Demand
Ethereum is currently trading at $2,660 after an underwhelming Friday, where the price dropped 7% following the Bybit hack news and overall market uncertainty. Bulls are struggling to reclaim key resistance levels, and the lack of strong demand at current levels raises concerns about Ethereum’s ability to recover.
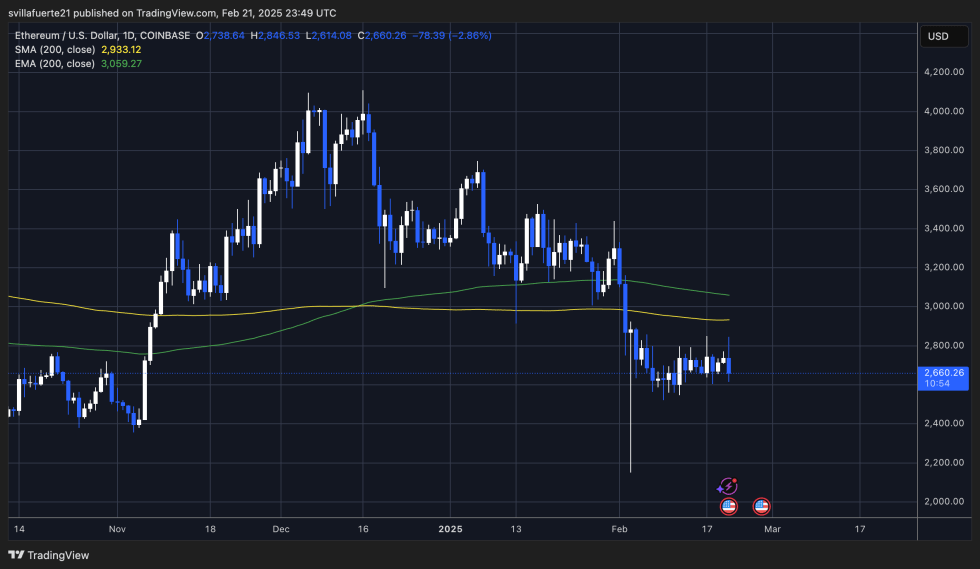 ETH testing short-term demand | Source: ETHUSDT chart on TradingView
For Ethereum to confirm a bullish breakout, it must reclaim the $2,800 mark and push above $3,000 to gain momentum for a sustained rally. However, the lack of significant buying pressure suggests that ETH could continue consolidating in a tight range unless buyers step in soon.
Despite the lack of immediate strength, ETH remains above the $2,600 support level, which has acted as a key demand zone in recent weeks. As long as Ethereum holds above $2,600 and starts reclaiming key levels above $2,800, the possibility of a bullish reversal remains on the table. If demand increases and ETH can establish a foothold above $2,800, a bullish phase could start at any moment. However, if Ethereum fails to hold above support levels, it could see further downside pressure in the coming days.
Featured image from Dall-E, chart from TradingView


 English (US) ·