Grass token price rose for three consecutive days, reaching its highest level since Feb. 23 as network data activity increased.
Grass (GRASS) surged to a high of $2.10, up 122% from its lowest point this year, giving it a market cap of over $500 million.
The ongoing rally is driven by the amount of data scraped daily. After surpassing 1 million gigabytes on Feb. 15, the figure rose to a new high of 1.32 million gigabytes on Wednesday. This data has been on a strong upward trajectory, considering it started the year at 2,600 gigabytes.
Grass has continued expanding its network by scraping over 109.7 million IP addresses and indexing 4.47 billion URLs since its inception.
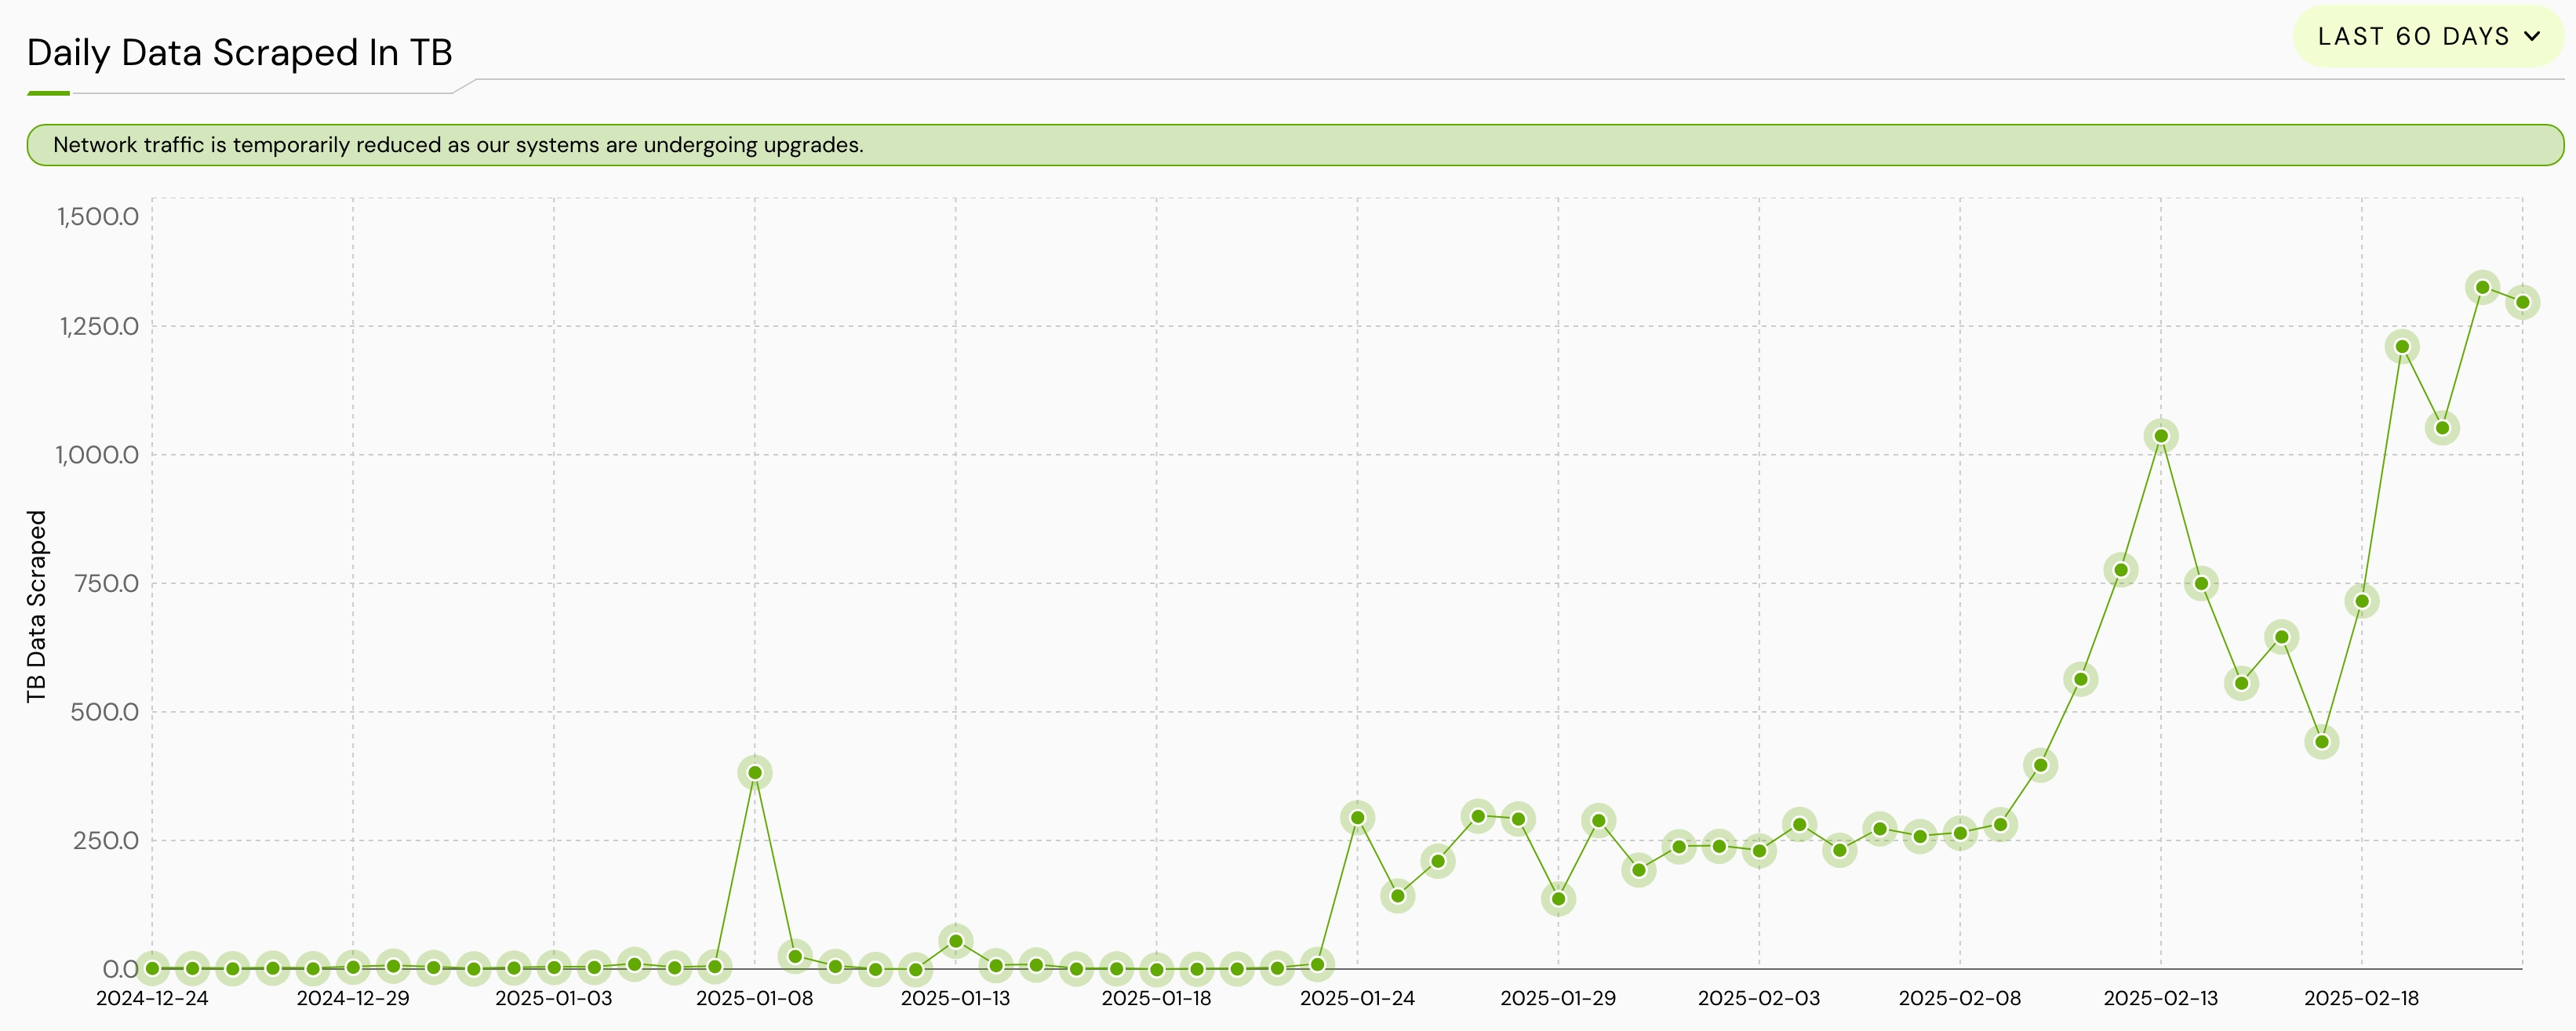 Grass data scrapped | Source: Grass
The network has made significant efforts to achieve these metrics. It launched the Grass Sion upgrade earlier this month, enhancing its ability to scrape and process multimodal web data. The upgrade also improved its scraping algorithms, introduced horizontal computing scaling, and increased its scaling capacity to 1 petabyte per day.
Grass Sion Upgrade
– Network upgrade that significantly enhances @getgrass_io
network's capability to scrape and process multimodal web data (text, images, and 4K video) at scale.
– Improved scraping algorithms without additional compute, leading to a major increase in data… pic.twitter.com/yE6ZFU5VMB
Grass plans to have a bigger year than in 2024, when its user base grew from 0.2 million to 3 million. In addition to the Sion upgrade, the developers aim to launch a standalone web app and deprecate the Chrome extension.
Grass price forecast
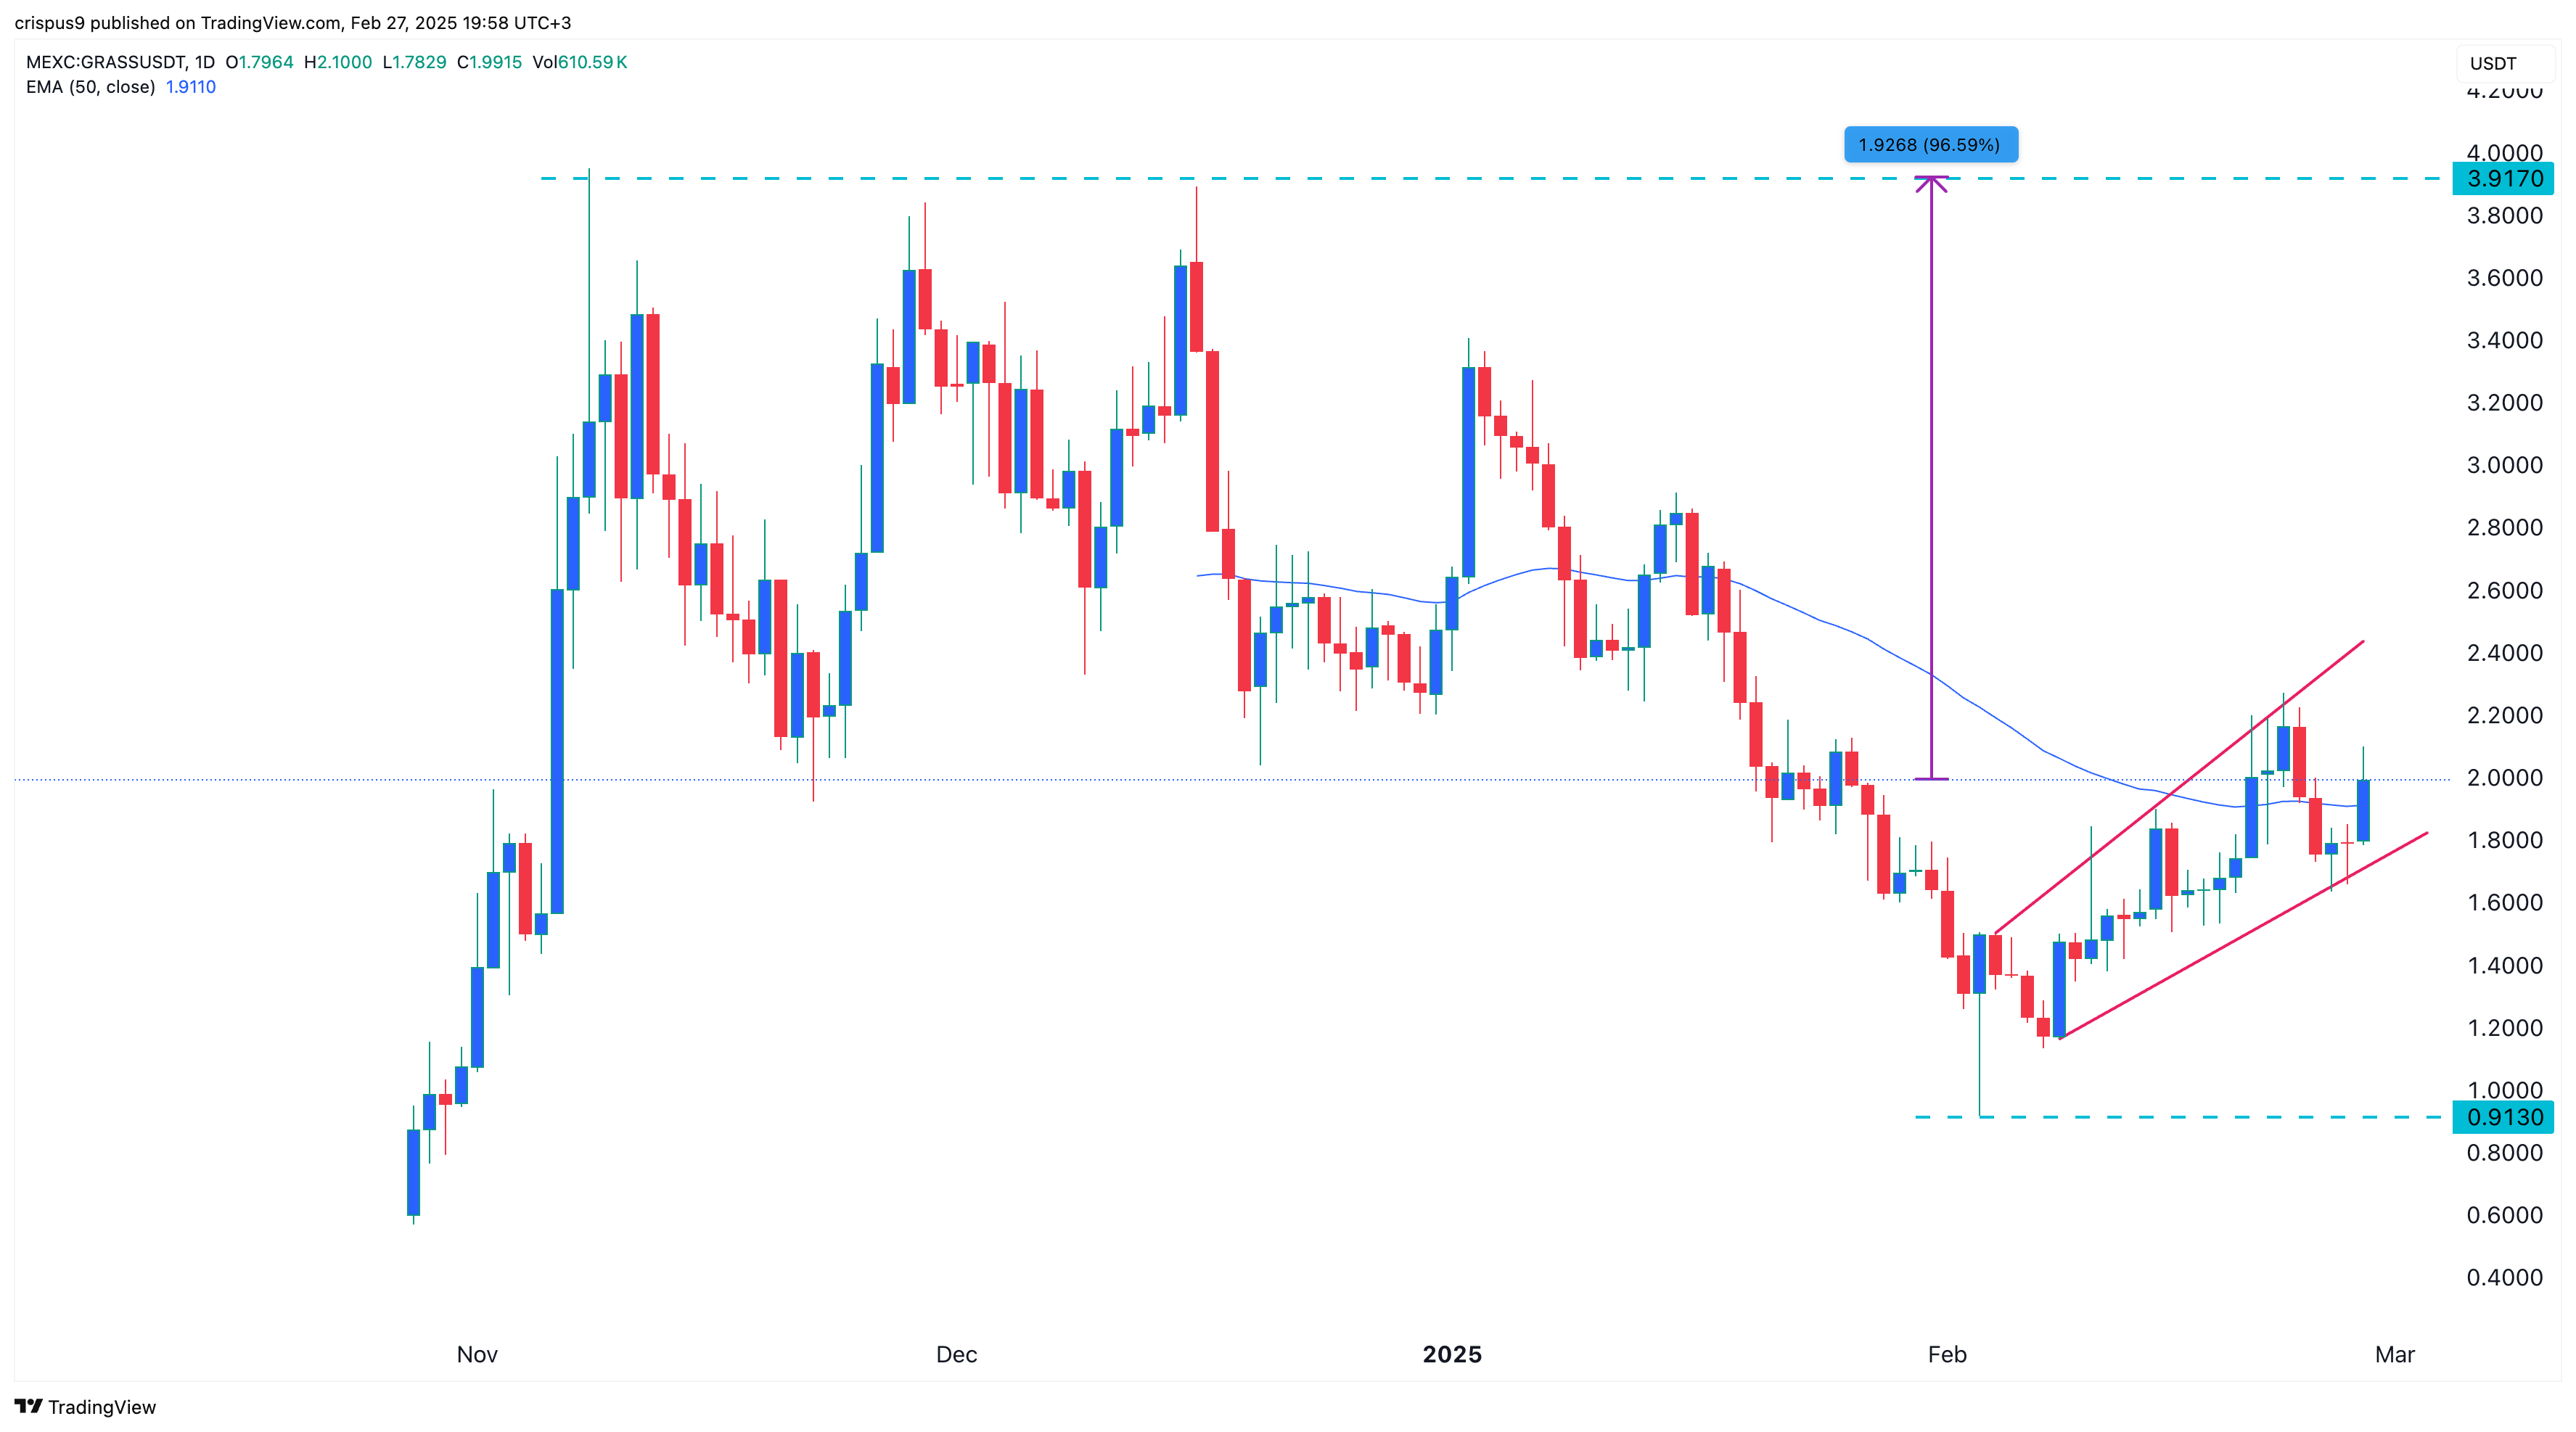 Grass price chart | Source: crypto.news
The daily chart shows that the GRASS token price bottomed at $0.9130 in January before rebounding to the current level of $2. It has moved slightly above the 25-day moving average, a positive sign.
Most importantly, Grass price has formed a megaphone pattern, characterized by two ascending and diverging trendlines. This pattern often signals a strong bullish breakout, which, in this case, would be confirmed if the price rises above the upper resistance level at $2.30.
Such a breakout could signal further gains, potentially pushing the price toward its all-time high of $3.9170, representing a 96% increase from the current level. However, a drop below the lower support level of $1.60 would invalidate the bullish outlook.


 English (US) ·