Hedera Hashgraph token pulled back on July 24, mirroring the performance of most altcoins.
Summary
- HBAR price has moved to a local bear market as Bitcoin and most altcoins pulled back.
- Hedera may rebound as the total stablecoin market capitalization nears a record high.
- HBAR token has formed a golden cross and a break-and-retest pattern on the daily chart.
Hedera (HBAR) price plummeted to an intraday low of $0.2318, entering a local bear market after a 22% decline from its highest point this month.
Stader token jump and stablecoin growth
HBAR price has some potential bullish catalysts that may lead to a comeback. First, there are signs that its ecosystem is doing well, with Stader (SD) token jumping by over 50% in the last 24 hours and 137% in the last seven days.
Stader is the biggest dApp in its ecosystem with over $109 million in assets. Its platform enables users to stake their HBAR tokens and generate a monthly return. Stader’s assets have jumped by over 36% in the last 30 days.
Other dApps in Hedera’s ecosystem have continued growing this month. SaucerSwap’s TVL has jumped by 51% in the last 30 days to over $68 million, while Bonzo Finance’s assets have soared by 83% to $47 million.
Further, Hedera Hashgraph is slowly becoming a major player in the stablecoin industry. Data shows that the stablecoin market capitalization has increased by 27% over the last seven days to $210 million. If the trend continues, the stablecoin volume will surpass the all-time high of $214 million soon.
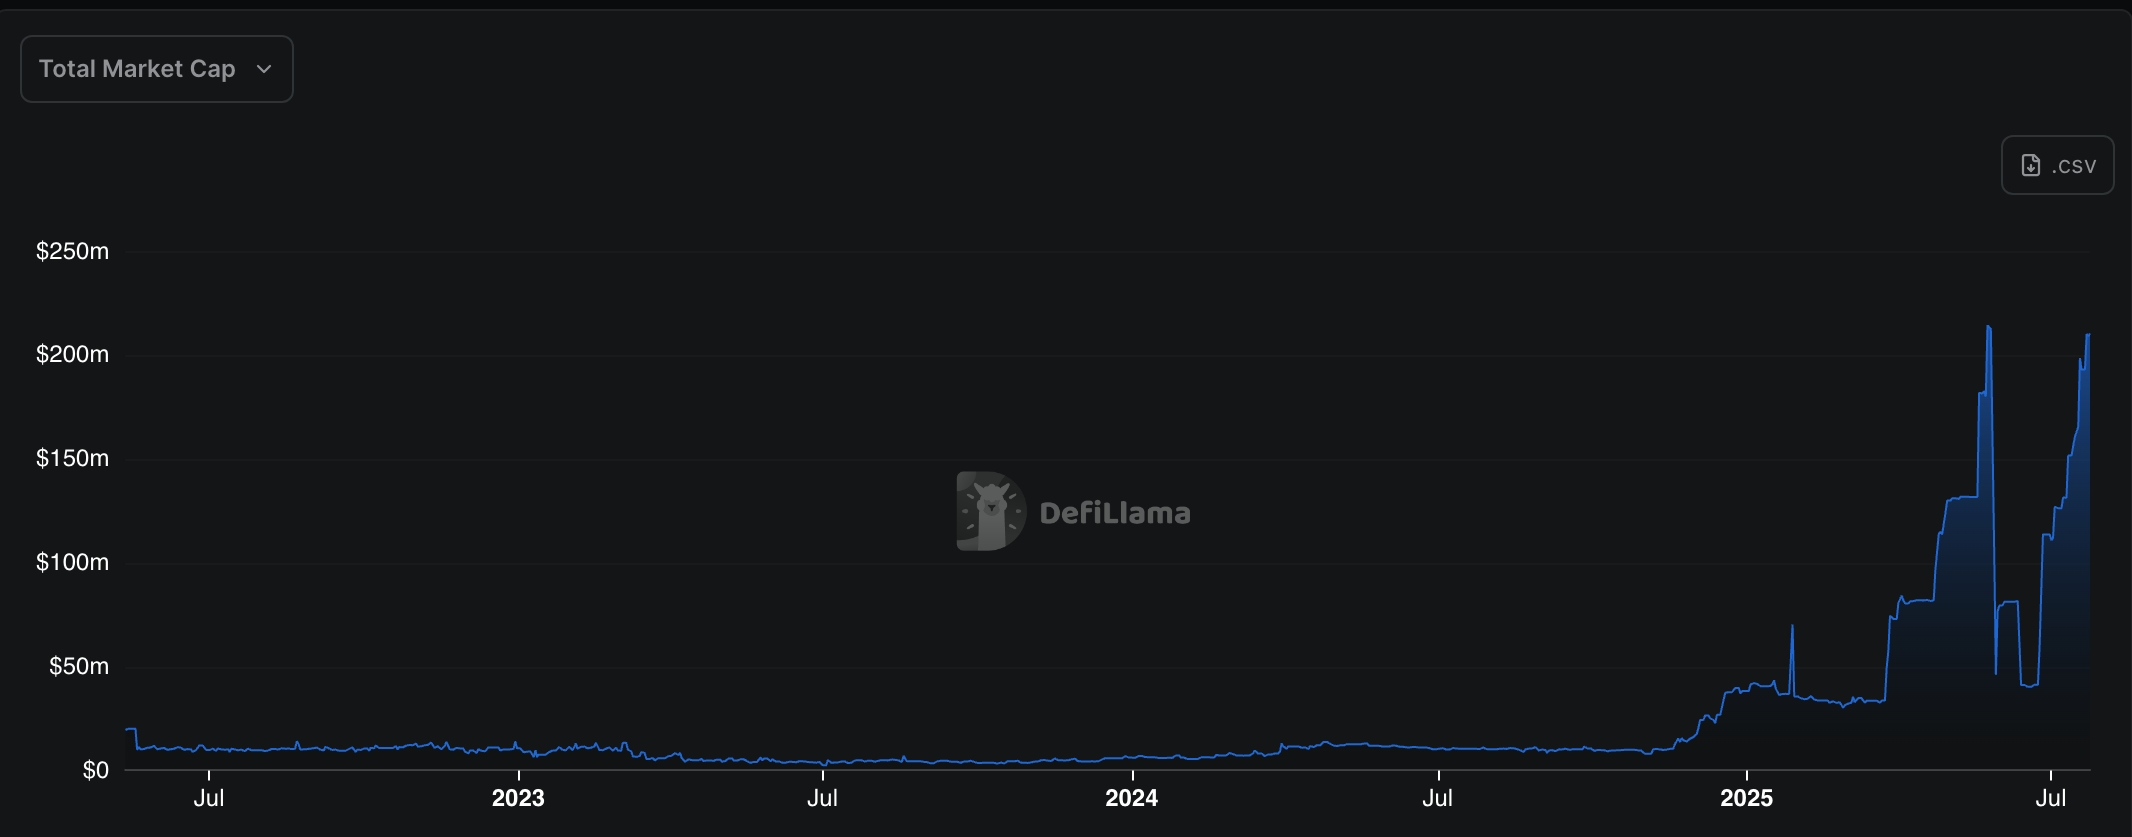 Hedera stablecoin market cap | Source: DeFi Llama
HBAR price will also benefit from the potential approval of a spot Hedera exchange-traded fund by the Securities and Exchange Commission. Bloomberg’s Eric Balchunas believes that the odds of Grayscale’s and Canary’s ETF approval are significantly high.
Recent data shows that there is strong demand for both Bitcoin and altcoin ETFs. Bitcoin (BTC) ETFs have had over $54 in inflows since inception, while Ethereum have had $8.65 billion.
HBAR price technical analysis
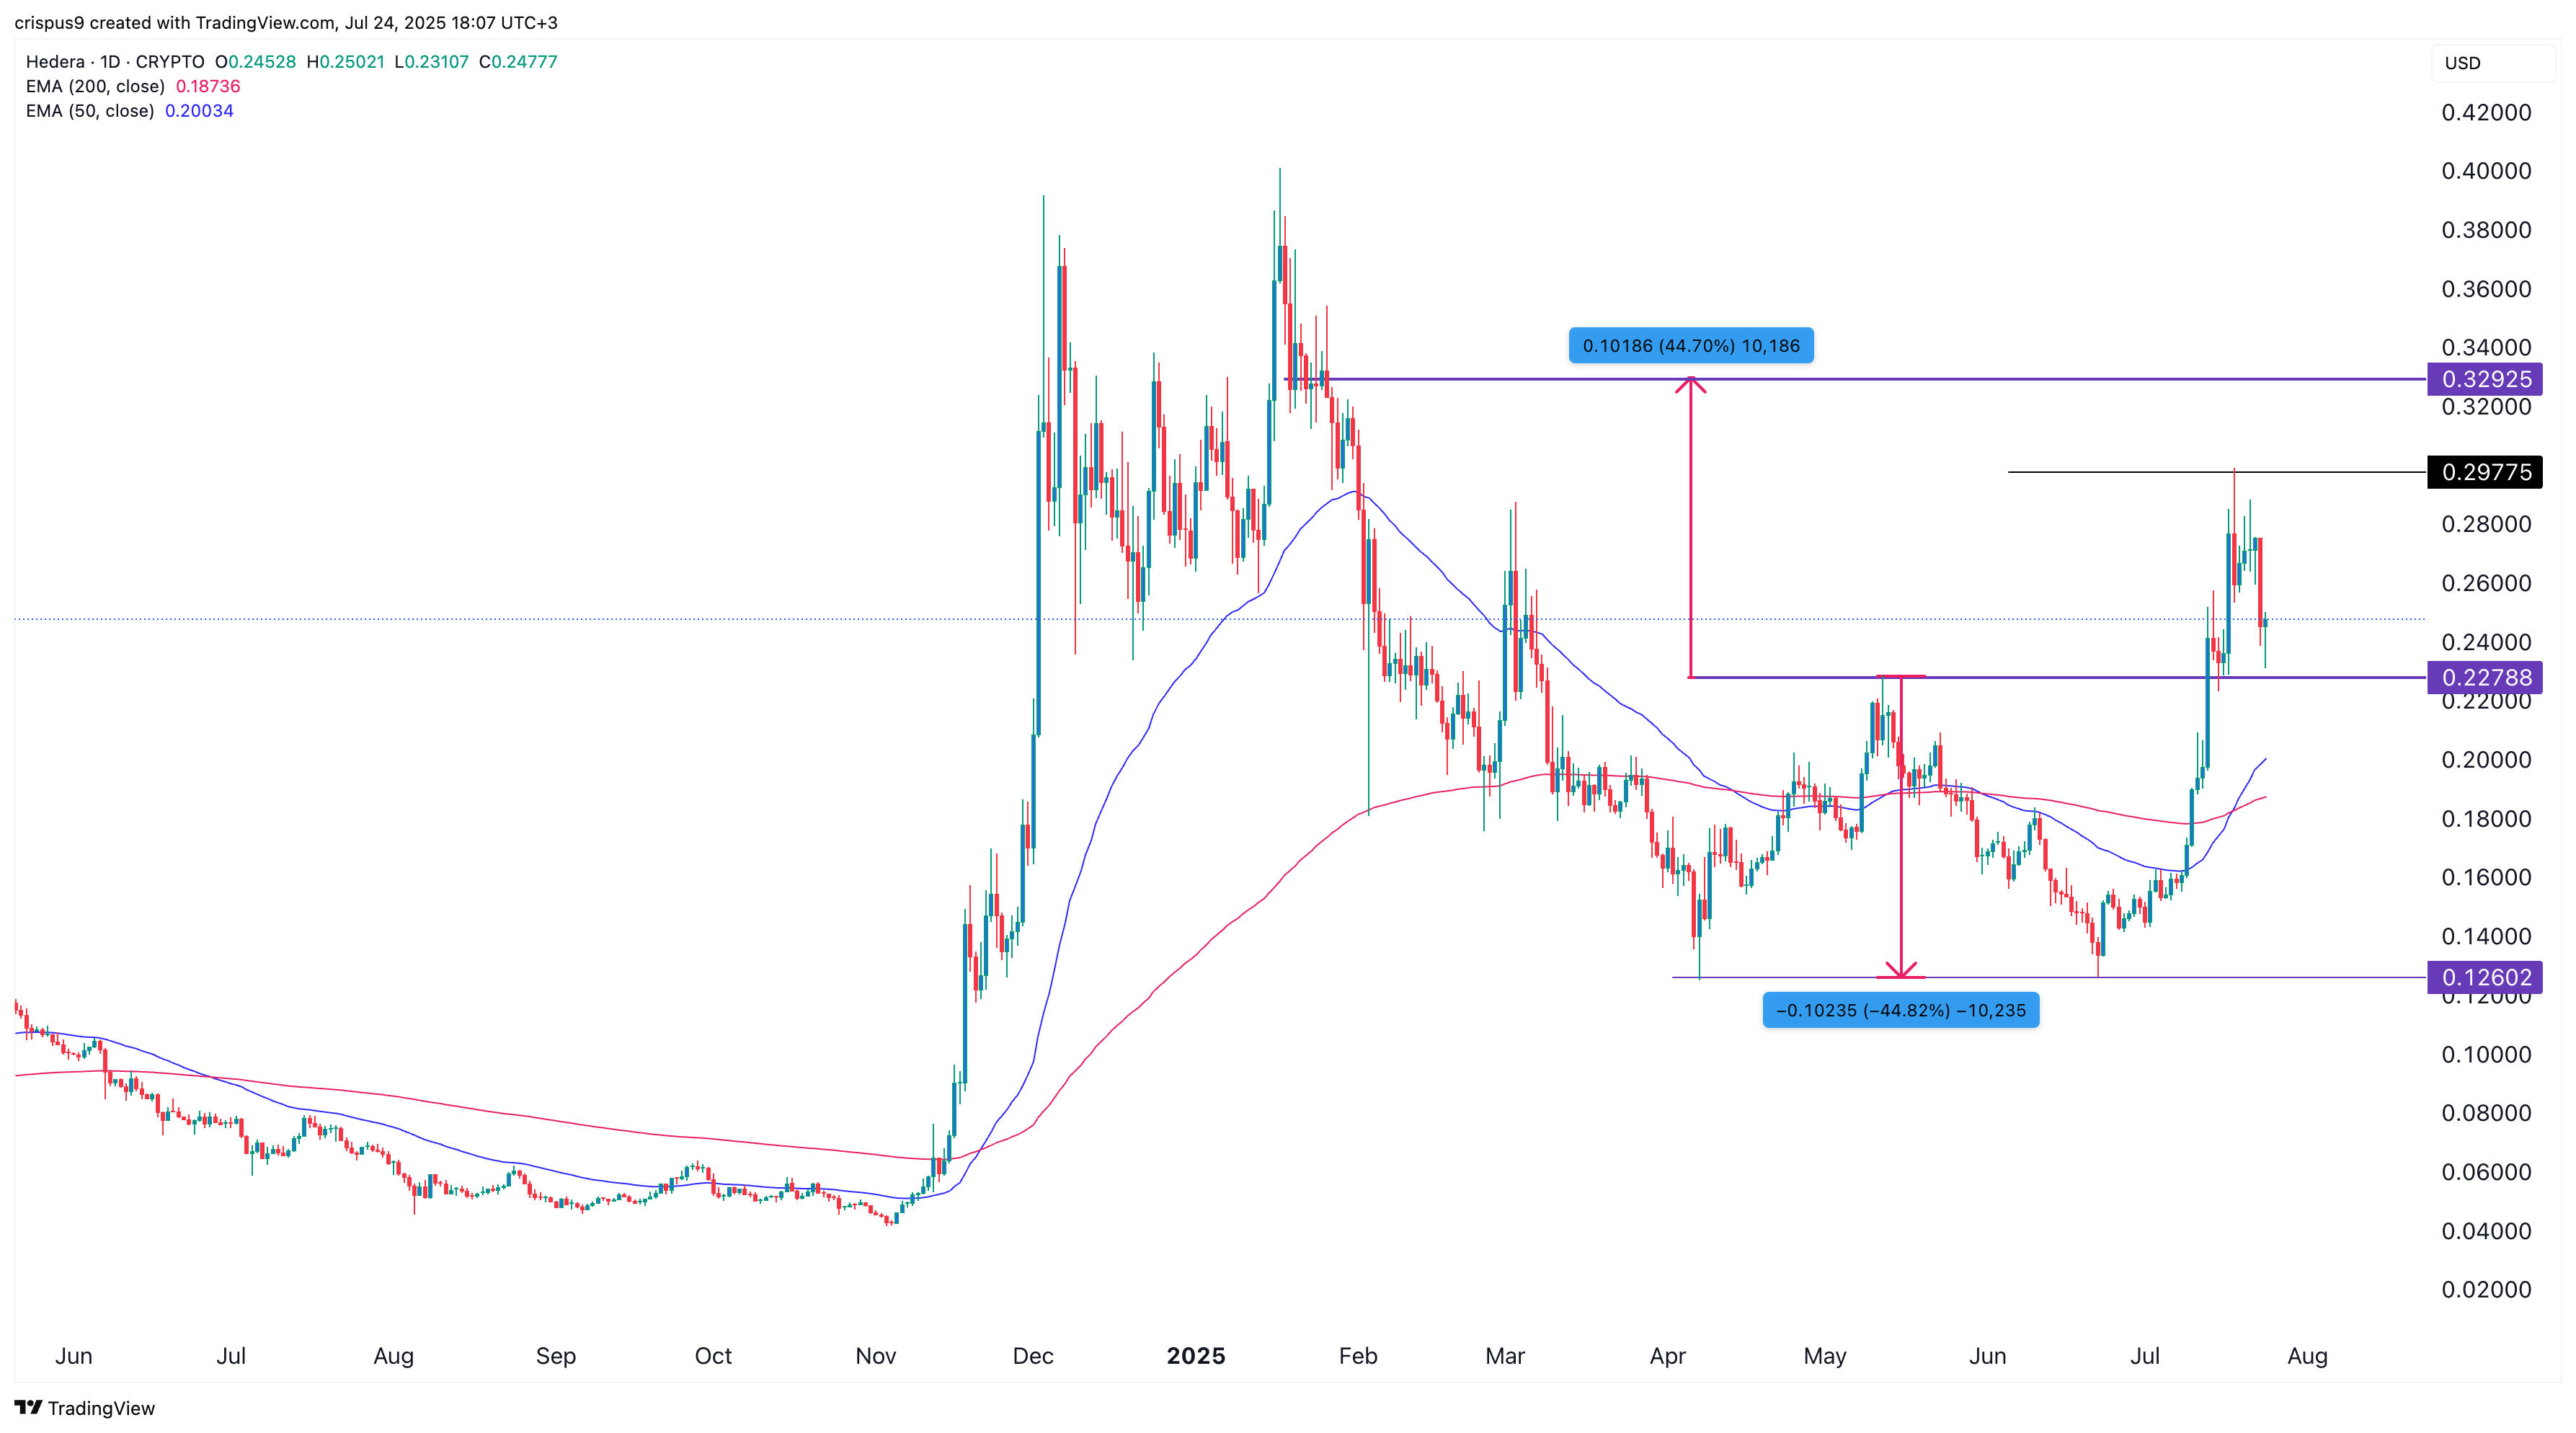 Hedera price chart | Source: crypto.news
The daily timeframe shows that the HBAR crypto price has pulled back in the past few days, moving from a high of $0.2977 to $0.2280. Its lowest level was notable because it coincided with the neckline of the double-bottom pattern at $0.1260.
Falling to that price is notable because it is a sign of a break-and-retest chart pattern, a popular continuation sign. Most importantly, Hedera price has formed a highly bullish golden cross pattern, which happens when the 50-day and 200-day moving averages cross each other.
Therefore, the most likely scenario is where Hedera bounces back, and possibly retests this month’s high of $0.2977. A move above that level will indicate further upside to $0.3292. This target is derived by measuring the height of the double-bottom and the same distance from the neckline.


 English (US) ·