 3 weeks ago
12
3 weeks ago
12
IOTA price is trading at a critical juncture, with both the daily and hourly charts reflecting a tug-of-war between sellers and buyers. As of June 12, 2025, the IOTA price has dropped to $0.1861 on the daily and $0.1846 on the hourly, sparking concerns about whether a deeper crash is likely—or a short-term reversal is brewing. Here's a detailed technical breakdown.
IOTA Price Prediction: What Does the IOTA Daily Chart Reveal?
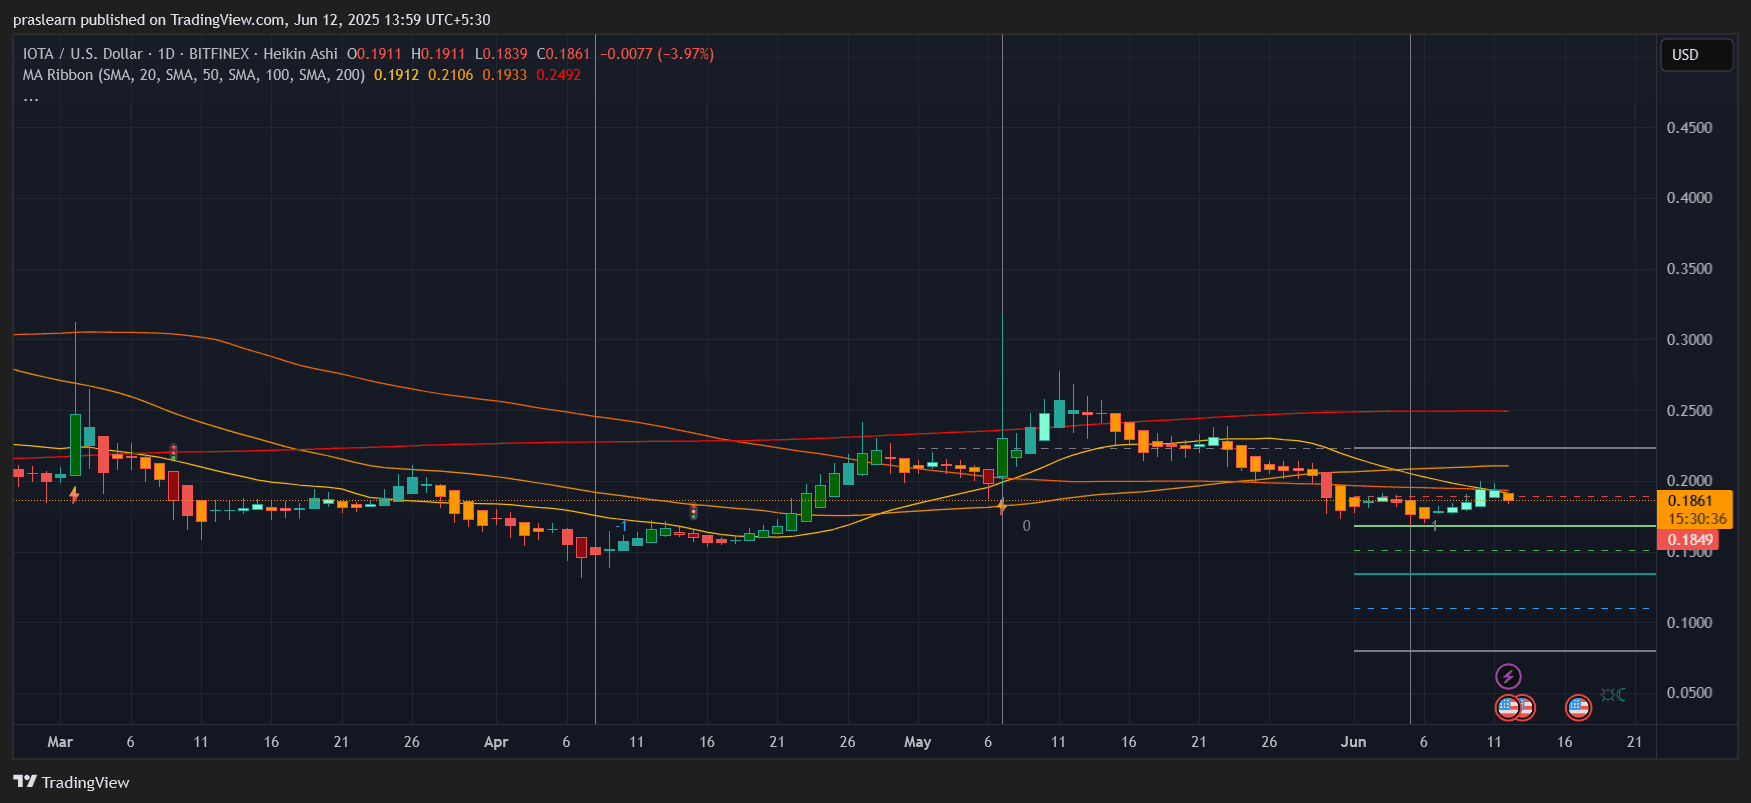 IOTA/USD 1 Day Chart- TradingView
On the daily chart, IOTA price has declined nearly 4% today and is hovering just above a strong support cluster between $0.184 and $0.180. The 20-day SMA ($0.1912) and 50-day SMA ($0.2106) are both above the current price, showing that the asset is still under bearish control. The 200-day SMA at $0.2492 remains a long way off, and this acts as a ceiling for any mid-term rally.
From a price structure standpoint, the May rally that took IOTA near $0.26 failed to create a higher high, confirming this recent downtrend. A Fibonacci retracement from the April low to the May high suggests key levels at $0.182 (38.2%) and $0.162 (61.8%). The price recently bounced at $0.1849, making this level crucial—if it breaks, we could fall toward $0.16 swiftly.
Is the Hourly Chart Signaling a Temporary Rebound?
 IOTA/USD 1 Hr Chart- TradingView
Zooming into the hourly chart, IOTA price shows a mini-consolidation phase after rejecting the $0.20 resistance multiple times over the last 48 hours. There was a clear breakout attempt on June 10 that touched $0.215, but the move was quickly reversed. This fakeout indicates that bulls are running out of steam unless volume returns.
The hourly 20, 50, and 100 SMAs are converging at $0.1875–$0.1907. This zone is acting like a gravity point. If IOTA can sustain above $0.190, there's room for a push back to $0.198 and potentially $0.205. However, the latest hourly candle is trading below all major SMAs, which could invite further downside.


Is IOTA Oversold? RSI and Price Action Suggest So
Looking at the RSI across both timeframes, IOTA price is nearing oversold territory. While we don't see extreme panic yet, the steady decline without any major bounce over the past two weeks hints at seller exhaustion. A simple price-to-SMA calculation shows:
IOTA is trading 11.4% below its 50-day SMA:
(0.2106−0.1861)/0.2106=0.116
This discount historically leads to mean reversion moves of 5–8% within a few sessions.
If we assume a modest 6% bounce from $0.1861, the target would be:
0.1861×1.06≈0.1973
This puts the $0.197–$0.200 zone within short-term reach, provided the current support holds.
IOTA Price Prediction: What Happens If $0.18 Breaks?
This is the key bear scenario. If $0.1849 gives way, IOTA price could drop to the next support near $0.162 (as per Fibonacci levels). That’s a 12.9% potential drop:
(0.1861−0.162)/0.1861=0.129
This makes the next two days crucial for IOTA holders. A clean break below $0.18 will likely trigger cascading sell orders, sending the price toward multi-month lows.
Conclusion: Bounce or Breakdown?
Right now, IOTA price sits on a weak but crucial support base. The short-term indicators suggest that a bounce to $0.197–$0.200 is possible, especially if the price closes above $0.190 on the hourly. However, the daily structure still leans bearish, and any bounce might be short-lived unless volume confirms a trend reversal.
For traders, $0.1849 is the key level to watch. Hold above it, and you get a 6% bounce. Lose it, and you risk a 13% drop. The next 48 hours will likely decide the fate of IOTA for the rest of June.
$IOTA


 English (US) ·