 3 hours ago
3
3 hours ago
3
Key Notes
- KTA jumped 15% in 24 hours, pushing its market cap to $663 million.
- An upcoming stress test for KTA’s mainnet is driving investor confidence.
- A trader turned $171K into $9.3M on KTA in just three months.
While the broader crypto market started slow on Monday, Keeta (KTA) is riding a strong wave of momentum. The cryptocurrency posted a 15% gain over the last 24 hours, pushing its market capitalization to $663 million.
This surge puts KTA within striking distance of entering the top 200 cryptocurrencies by market cap. CoinMarketCap data reveals that the 24-hour trading volume has also seen a 33% uptick, suggesting growing investor interest.
KTA’s bullish run is attributed to its upcoming stress test scheduled for June, designed to validate its claimed Transactions Per Second (TPS) performance ahead of the highly anticipated mainnet launch.
Crypto advisor NekoZ fanned investor enthusiasm on X, predicting that KTA may hit the $2 mark “soon.” Notably, the token has already seen a 71% price spike in just the past week, adding $300 million to its market cap.
$KTA's road to 5 billion is about to really start, and a lot of people waiting for dips will be heavily sidelined.
Majority of the large holders know what they have, and that is a very undervalued institutional chain that deserves to be 10x higher in MC. https://t.co/ttjtioPKyF
— NekoZ (@NekozTek) June 8, 2025
Interestingly, the surge resulted in a smart trader, identified as 0x11e1, turning a $171,000 investment into a massive $9.3 million in just three months. As per the data by LookonChain, they accumulated 6.02 million KTA tokens in March.
Trader 0x11e1 turned $171K into $9.3M on $KTA in 3 months, a 54x return!
He spent 91.5 $ETH($171K) to buy 6.02M $KTA about 3 months ago, which is now worth $9.3M.https://t.co/kolsNR414l pic.twitter.com/KHio6YszLH
— Lookonchain (@lookonchain) June 9, 2025
Since then, the token’s price rocketed over 10x, with the trader netting a 54x return. At the time of writing, KTA is trading around $1.64.
KTA Price Outlook
On the 4-hour chart, KTA is maintaining strong momentum above the midline of the Bollinger Bands. This suggests sustained buying pressure, with volatility expanding—a sign of a possible continuation in the uptrend.
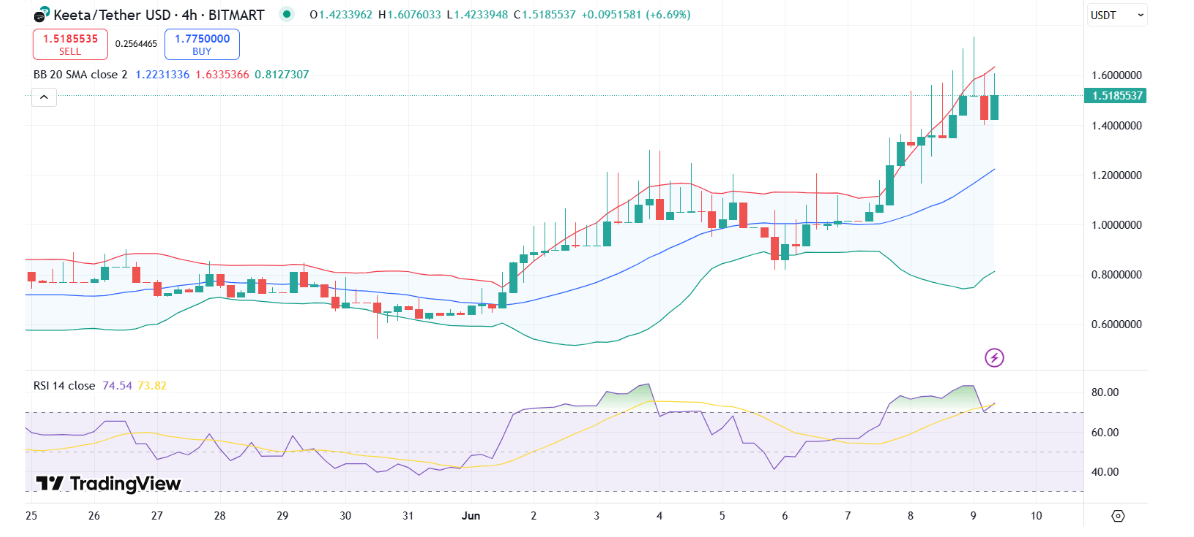
KTA price chart with RSI and Bollinger Bands | Source: TradingView
A break below the $1.22 support level could send the price toward the lower Bollinger Band near $0.81.
The RSI sits at 74.54, indicating overbought conditions. This points to potential short-term consolidation or a minor pullback, but also confirms strong bullish sentiment. Key resistance lies at $1.64, with a breakout potentially leading to $1.75.
Meanwhile, the broader Real-World Assets (RWA) token market, of which Keeta is a part, has crossed a $38.6 billion valuation. This suggests robust macro-level support for future gains.
Disclaimer: Coinspeaker is committed to providing unbiased and transparent reporting. This article aims to deliver accurate and timely information but should not be taken as financial or investment advice. Since market conditions can change rapidly, we encourage you to verify information on your own and consult with a professional before making any decisions based on this content.
Altcoin News, Cryptocurrency News, News

A crypto journalist with over 5 years of experience in the industry, Parth has worked with major media outlets in the crypto and finance world, gathering experience and expertise in the space after surviving bear and bull markets over the years. Parth is also an author of 4 self-published books.


 English (US) ·