 3 hours ago
2
3 hours ago
2
Litecoin (LTC) price just staged a powerful breakout, closing the day at $104.95 with a 5.46% gain. Based on the Heikin Ashi daily chart and supporting indicators, this surge looks technically meaningful — and potentially the beginning of a much larger move. Let's dive deep into the current LTC price setup and examine whether $120 is the next logical target.
LTC Price Prediction: Why Did Litecoin Price Just Spike?
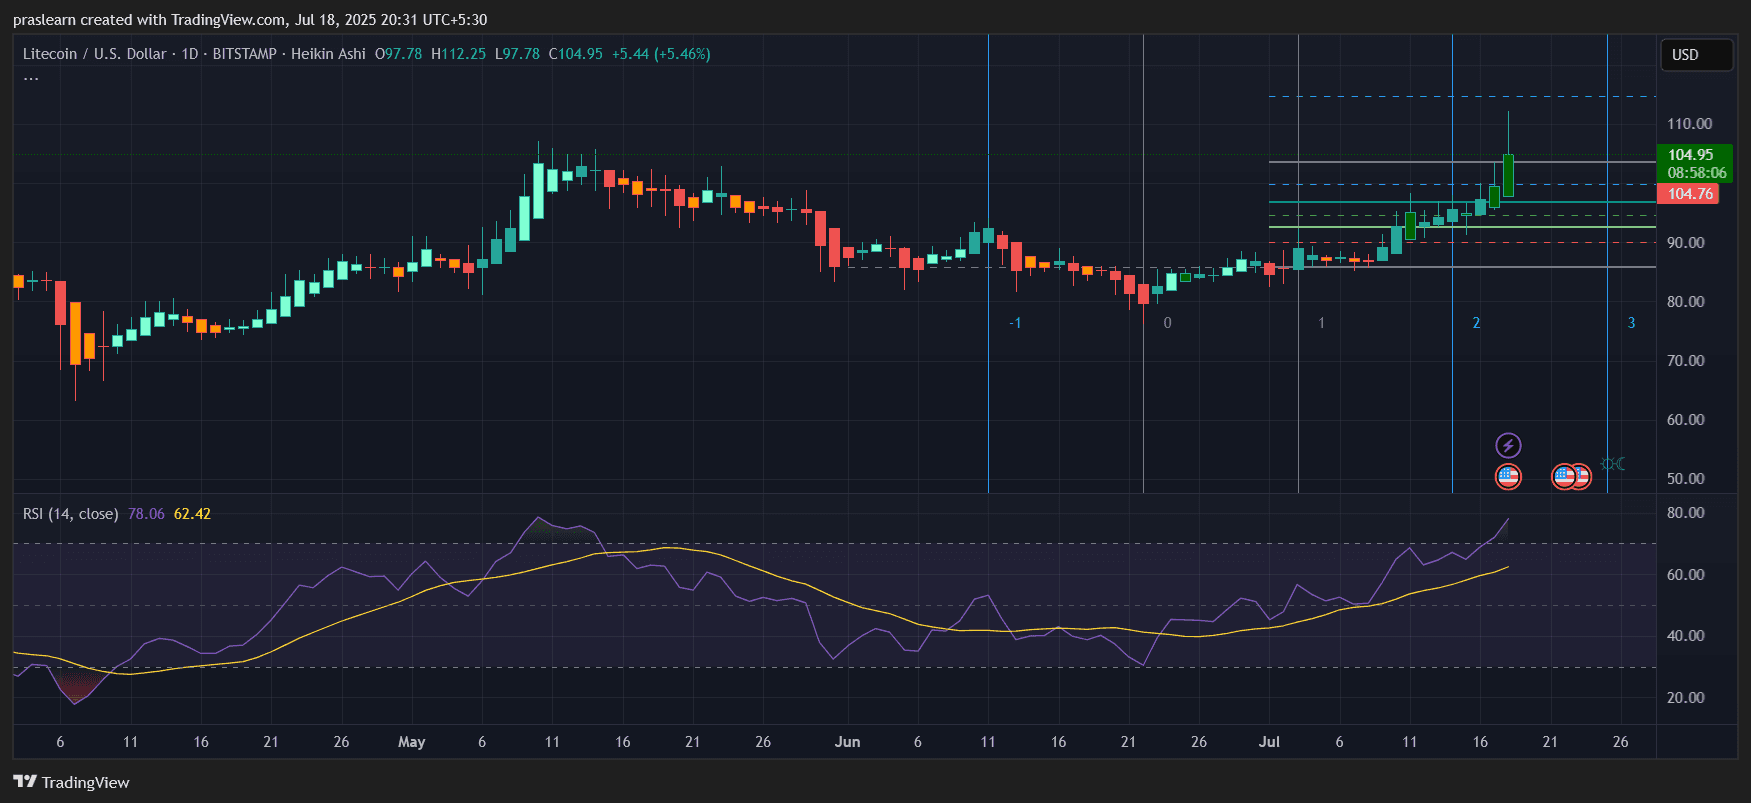 LTC/USD Daily Chart- TradingView
Litecoin price recently broke out of a multi-week consolidation range between $82 and $96. The current surge above $104 has pushed LTC price to its highest level since early June. The candlesticks on the Heikin Ashi chart show strong bullish momentum — with long green candles and no lower shadows, indicating sustained buying pressure.
Is This a Fibonacci-Based Breakout?
Yes — and the chart confirms it. The Fibonacci retracement tool (drawn from the previous local high to low) shows that Litecoin price has decisively broken past the 0.618 level (~$100.32), which typically acts as a "golden ratio" resistance. The next levels to watch are:
- 0.786 Fibonacci level at ~$107.60
- 1.0 Fibonacci extension at ~$112.25
These are not just random lines — historically, crypto assets tend to respect these Fibonacci levels due to their psychological and algorithmic importance.
Calculation Insight:
If we treat $82 as the swing low and $112 as the recent high, the total price range = $30. A 1.618 extension would give:
$82 + (1.618 x $30) = $82 + $48.54 = $130.54
This sets up a mid-term price target of $130.50, which aligns with our technical breakout theory.
RSI Warning or Confirmation?
The RSI (Relative Strength Index) is currently at 78.06, which indicates overbought conditions. However, this isn't necessarily a bearish sign. In breakout scenarios, RSI can remain in the 75–85 zone for extended periods during trending phases.
In fact, back in May, Litecoin price rallied from $84 to $112 even as RSI hovered around 80. We're seeing similar behavior now, suggesting the momentum is not exhausted — it's just heating up.
Chart Structure: 1-2-3 Pattern in Play?
Visibly, the Fibonacci lines and the blue cycle markers suggest a 1-2-3 bullish continuation pattern may be unfolding. The key base near $82 (marked as “0”) and the second low around $90 (“1”) set up the breakout leg. Point “3” could stretch to $112 or beyond if bulls maintain pressure.
Short-Term LTC Price Prediction: Where Is Litecoin Price Headed?
Given the breakout strength, momentum indicators, and Fibonacci structure, here's a likely scenario for the next few days:
- Support Zone: $96 to $100 (prior resistance, now flipped support)
- Immediate Resistance: $107.60 (0.786 fib), then $112.25 (1.0 fib)
- Bullish Extension Target: $120–$130 (1.272 and 1.618 fib levels)
Expect some profit-taking near $112, but if LTC price holds $100 as support, the next leg could be explosive.
Is It Time to Buy LTC?
Litecoin’s current move is not a random spike — it’s a technical breakout backed by volume, pattern structure, and Fibonacci logic. While the RSI is high, the historical context shows LTC price thrives in high-momentum phases.
If Litecoin price holds above $100, the next major target could be $120–$130, offering a potential 15% to 25% upside in the short to medium term.
However, traders should watch for any fakeouts or closes below $96 — that would invalidate the breakout thesis.
Looking to Buy LTC? Try OKX
OKX is a top choice to buy LTC. With low trading fees, extensive token listings, and an intuitive interface, it’s a preferred platform for many crypto traders across Europe.
Special Promotion – Limited Time
Until September 14, 2025, OKX is hosting an exclusive McLaren F1 Team giveaway:
--> Receive a complimentary McLaren F1 Team cap <--
Enter to win a VIP trackside experience in Zandvoort (Aug 29–31)
This offer is open to all new European users who haven’t yet traded on OKX. Don’t wait – claim your reward today!
$LTC, $LTCPrice, $Litecoin


 English (US) ·