MDT (MDT), the native token of the decentralized data exchange platform Measurable Data, jumped nearly 170% on July 25. Could the token be gearing up for further gains?
Summary
- MDT surged nearly 170% on July 25, reaching a six-month high of $0.043.
- The rally followed the launch of RewardMe 2.0, which integrated MDT as the platform’s new crypto reward token.
- Technical indicators confirm a bullish breakout supported by a golden cross and falling wedge pattern.
According to CoinGecko data, MDT rose to a six-month high of $0.043, with its market cap climbing from approximately $10 million to $26.8 million within just three hours during early Asian trading hours on Friday.
Why is MDT price rising?
Over the last 24 hours, the altcoins’ daily trading volume shot up by more than 2,200%, which is usually a sign that retail investors may be fueling the rally.
MDT’s recent price surge appears to be supported by the official launch of RewardMe 2.0, which was announced by the RewardMe team in a July 22 post on X. The updated version introduces MDT as the platform’s new crypto-based reward option.
Under the new system, users can choose to receive rewards in MDT, which is now integrated into the app as both a cashback and staking token.
The platform has retired its legacy ME token, which previously served as an in-app reward unit. ME functioned as a closed reward point system and was not designed for blockchain use. Existing ME balances were converted to Reward Dollars at a 1:1 ratio. RD remains available for in-app redemptions like gift cards, though it is not transferable or blockchain-based.
The rollout of RewardMe 2.0 marks a broader transition from a closed rewards model to a blockchain-integrated system, positioning MDT at the center of the ecosystem’s future growth.
For the uninitiated, Measurable Data is a decentralized data exchange protocol that powers apps like RewardMe, its consumer-facing platform that lets users earn cashback by anonymously contributing purchase data, which is then aggregated and sold to data buyers for market insights, with value returned to participants through its native token, MDT.
Traders are accumulating
As of press time, MDT is showing slight signs of burnout with the Relative Strength Index well within the overbought territory at press time. While this doesn’t necessarily mean that the rally will end, it suggests that short-term profit-taking or a cooling-off period could follow if buying momentum slows.
MDT has dropped roughly 35% since hitting its recent high, but on-chain metrics continue to support a positive short-term outlook for MDT.
According to Nansen, the total supply of MDT held on exchanges has dropped by 7.3%, now totaling approximately $436.2 million.
The drop in MDT’s exchange balances can be considered a bullish signal. When tokens move off exchanges, it usually means holders are not looking to sell in the short term. This helps reduce immediate sell-side pressure.
MDT price prediction
On the daily price chart, MDT has broken out of a falling wedge pattern that had been forming since December 2024. A falling wedge is a bullish reversal pattern characterized by converging trendlines that slope downward, indicating a gradual loss of bearish momentum.
The recent breakout above the upper boundary of the wedge signals a potential shift in market structure toward a bullish trend.
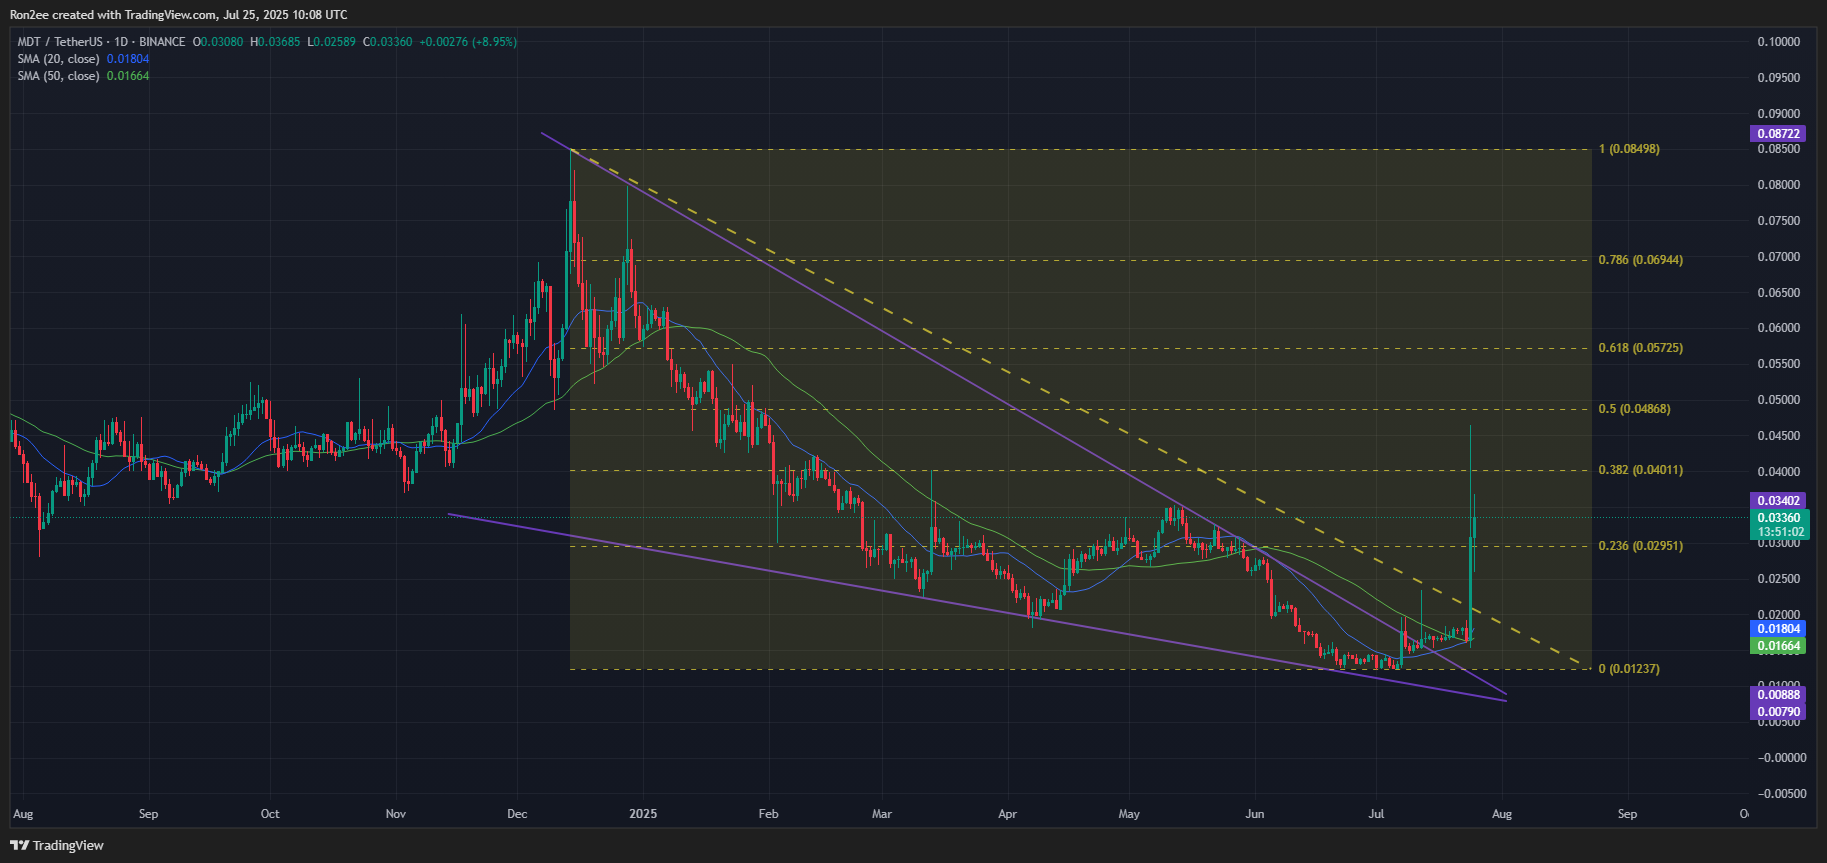 MDT price, 20-day and 50-day SMA chart — July 25 | Source: TradingView
The 50-day simple moving average has crossed above the 200-day moving average, forming a golden cross, which is typically viewed as a strong bullish indicator.
The Aroon indicator further supports the bullish outlook, with the Aroon Up reading at 92.86% and the Aroon Down at 0%. This configuration indicates a strong uptrend with minimal recent downward pressure, reinforcing the current breakout’s validity.
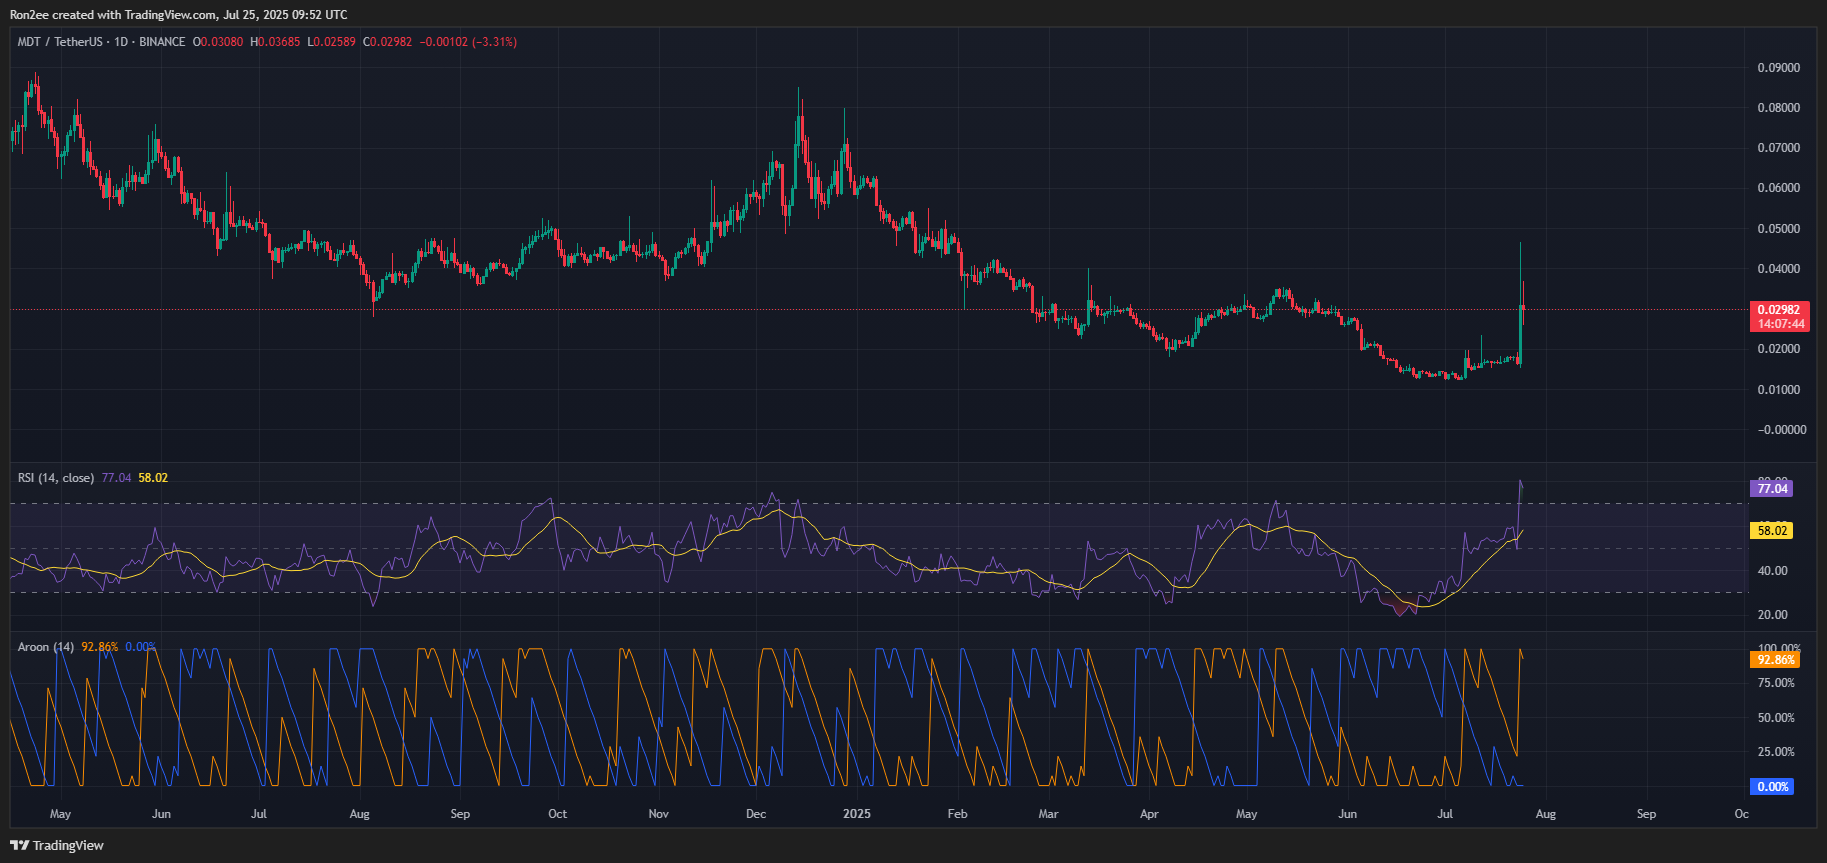 MDT Aroon and RSI chart — July 25 | Source: TradingView
Overall, these signs collectively point toward a constructive short-term outlook, though short-term volatility may emerge if RewardMe users start to lock in gains.
For MDT, the most likely target lies at $0.035, which the token failed to breach during its May run. If bulls manage to capture that, the next key target would be its December 2024 high of $0.08, which has historically acted as a key resistance level.
However, a drop below $0.0146 would invalidate this setup.
Disclosure: This content is provided by a third party. Neither crypto.news nor the author of this article endorses any product mentioned on this page. Users should conduct their own research before taking any action related to the company.


 English (US) ·