Pepe Coin price remained under pressure despite the ongoing crypto market rebound and positive whale activity.
Summary
- Pepe Coin price remains on edge despite the ongoing crypto market rally.
- The token also dropped as whales resumed their purchases.
- Technicals suggest that it has more downside in the near term.
Pepe (PEPE), the second-largest Ethereum (ETH) meme coin, traded at around $0.0000061 at last check on Monday, down 63% from its August high.
Data compiled by Nansen shows that whales have resumed buying Pepe as they expect a potential rebound. These whales now hold 4.19 trillion tokens, up by 800 billion from the October low of 4.18 trillion.
The ongoing whale buying is a sign that their recent selling momentum is starting to end, which is a good thing. Another positive is that investors have continued to move their tokens off exchanges.
Nansen data shows that there are 232 trillion tokens in exchanges, down from last month’s high of 241 trillion. Exchange outflows are a strong catalyst for a coin, as they signal that investors are moving them to self-custody. It is also a sign that these investors are not selling their tokens.
A potential reason Pepe remains under pressure despite these developments is that its futures market open interest has tumbled. It stood at $203 million on Monday, well below the September high of $800 million.
The falling open interest is a sign that traders have reduced their use of leverage after last month’s big liquidation. Over 1.6 million traders experienced a $20 billion wipeout. Pepe bulls suffered a $20 million on that day.
Pepe Coin price technical analysis
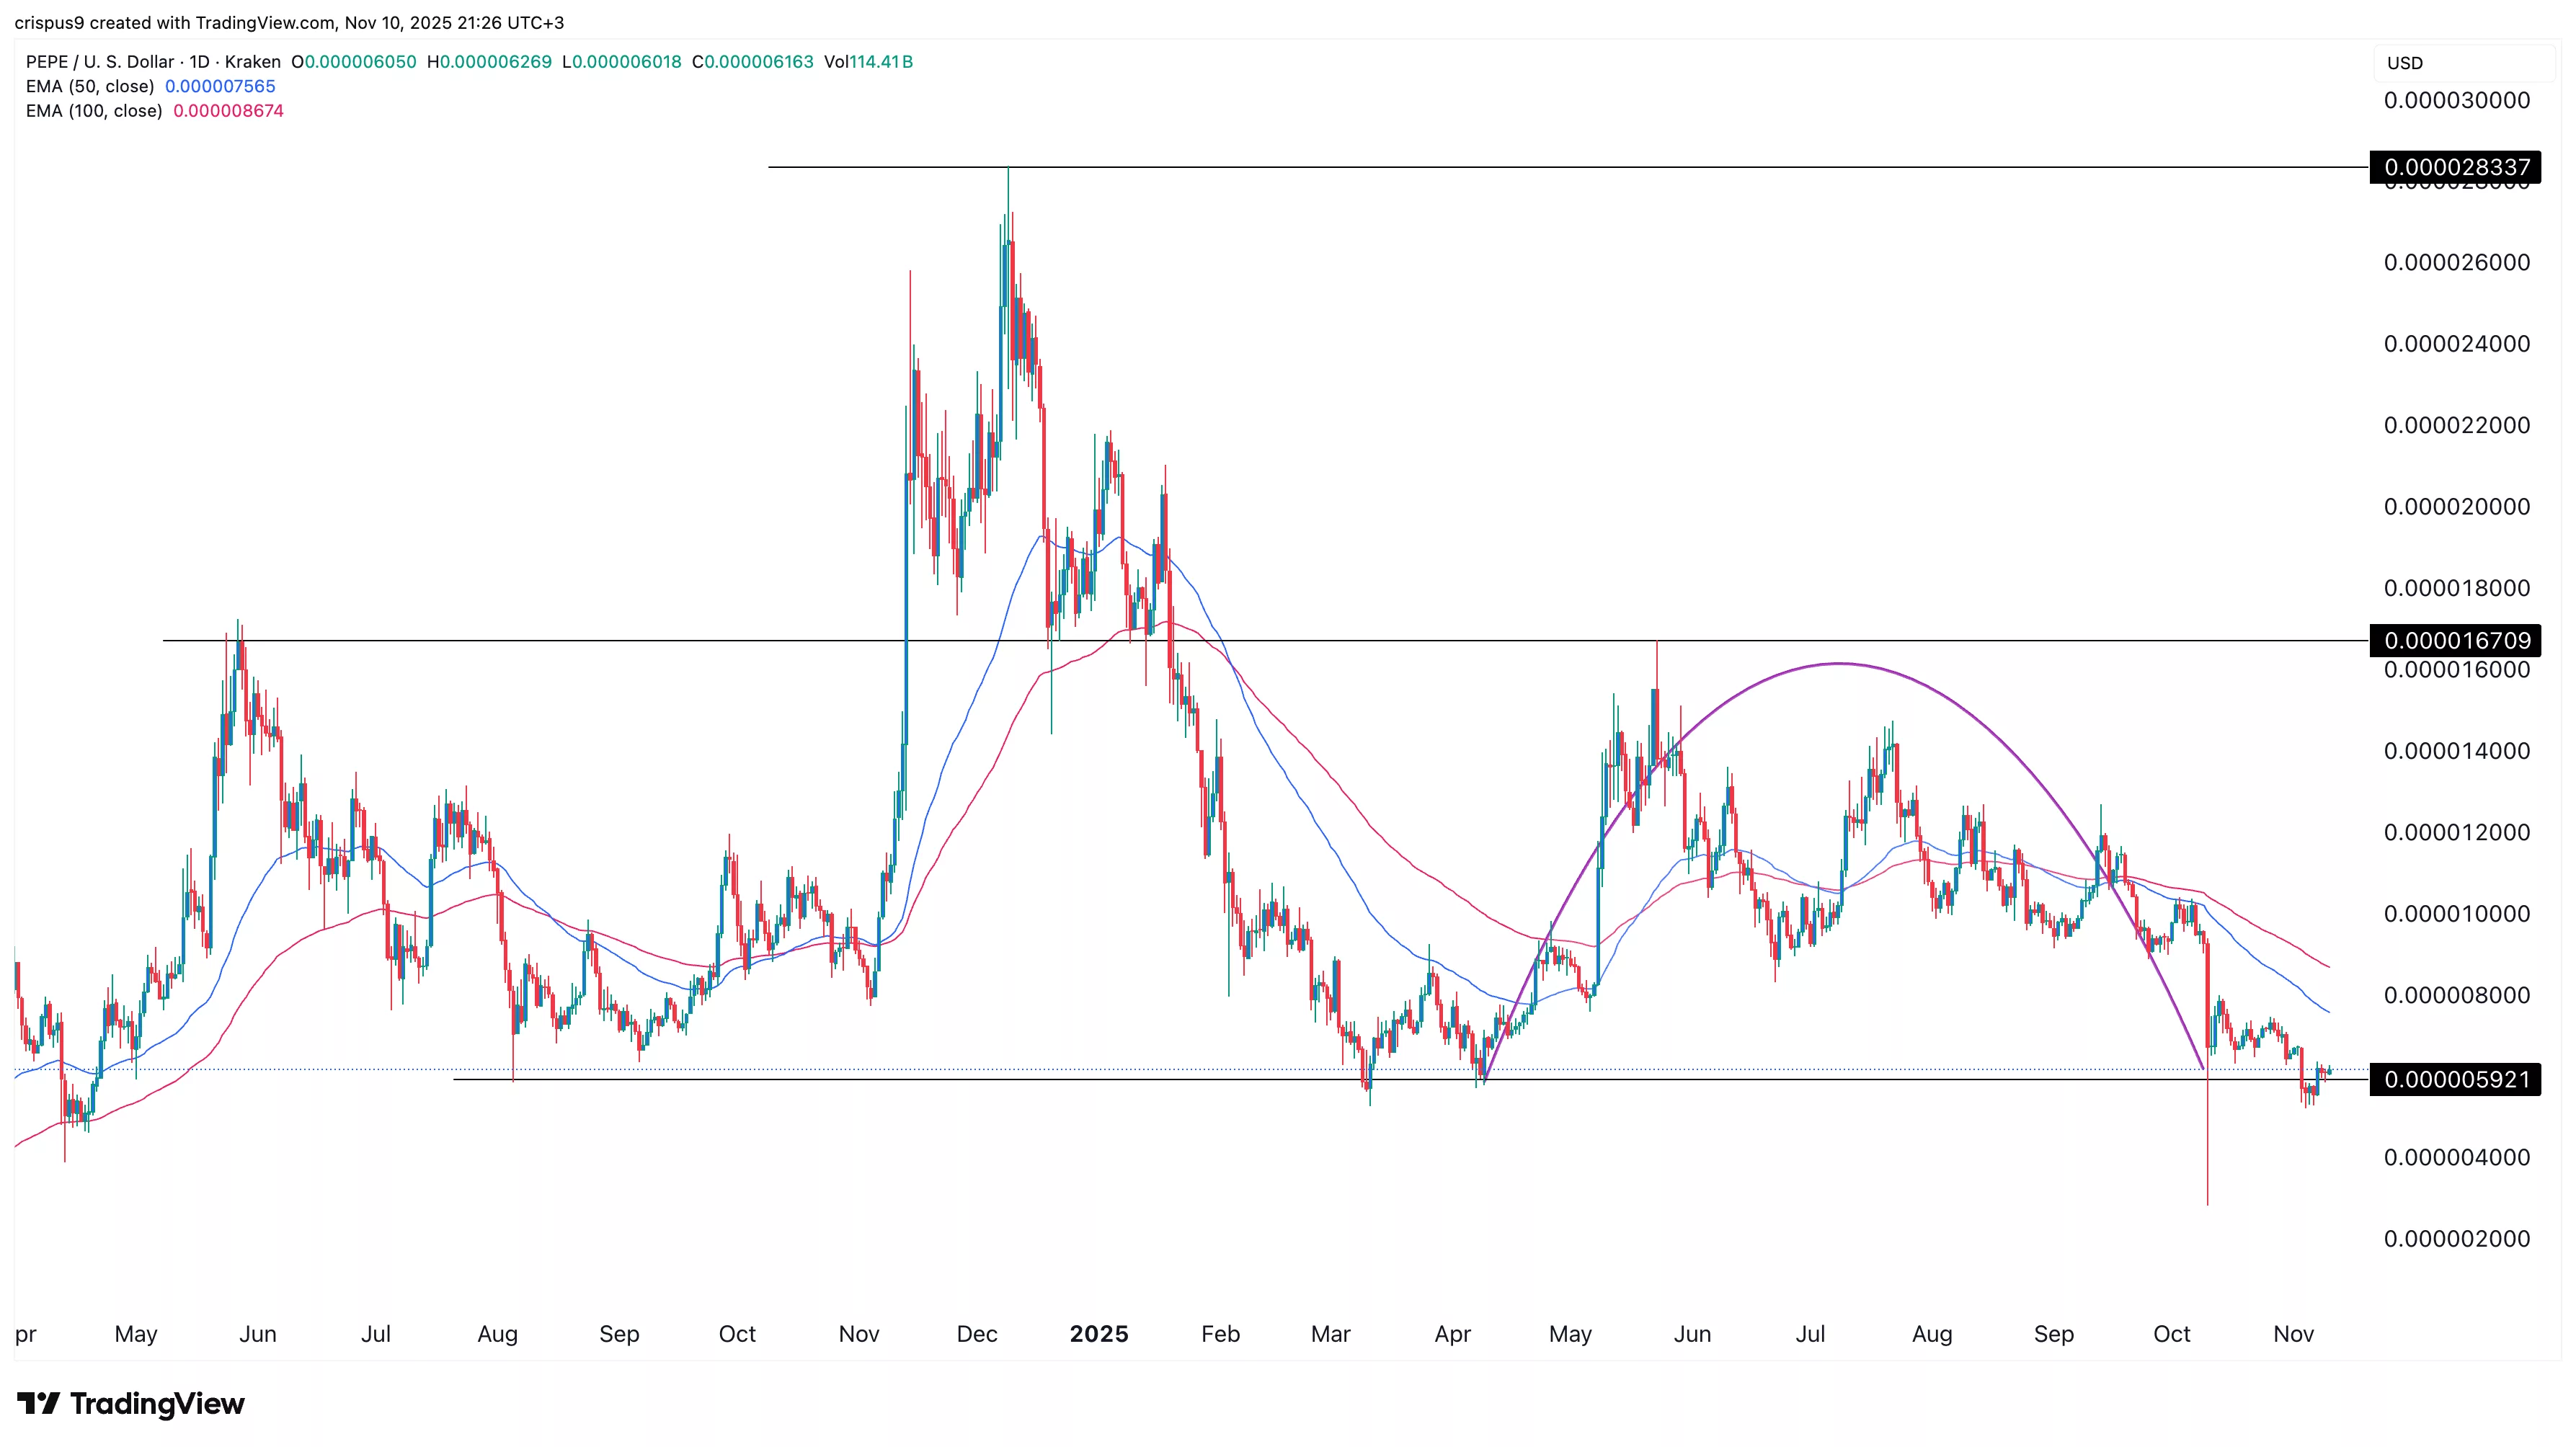 Pepe Coin price chart | Source: crypto.news
Technical analysis suggests that the Pepe token has more downside in the coming months. For one, it is now forming an inverse cup-and-handle pattern, a common continuation sign. It has moved to the handle section of this pattern.
Pepe Coin price has also formed a large head-and-shoulders pattern. This pattern’s head is $0.00002833, its all-time high. The right and left shoulders are at $0.00001670, while the neckline is at $0.000005920.
The token also remained below the 50-day and 100-day Exponential Moving Averages. Therefore, the most likely scenario is that the coin continues to fall as sellers target the key support at $0.000020, about 65% below the current level.


 English (US) ·