Pi Network is nearing a critical inflection point, as oversold conditions, declining volume, and technical confluence at support suggest a bullish reversal may be on the horizon. If reclaimed, the $0.99 swing high could be the next target.
After a strong bullish expansion in recent weeks, Pi Network (PI) has entered a corrective phase, trending downward in a structured fashion. The current market action remains technically valid, especially when considering the strength of the preceding trend. A swing high has formed at $0.99, and a swing low has been printed around $0.66.
These two price levels now frame a range where accumulation may occur before the next directional move, likely to the upside if support holds and volume returns.
Key technical points
- Dynamic Resistance Compression: Price has been repeatedly rejected by descending trendline resistance, creating a coiling apex structure against major support.
- 0.618 Fibonacci Confluence: The key support region aligns with the 0.618 retracement from the recent swing, increasing its technical significance.
- Volume Profile Support: Price is trading near the value area low around $0.70, a major historical demand zone with previous bullish reactions.
- RSI Approaching Oversold Levels: The RSI is nearing the critical 30 threshold; prior dips into oversold territory have historically led to significant bullish reversals.
- Point of Control Reclaim at $0.74: A reclaim of the POC would confirm the value area low as valid support and increase the probability of a move toward $0.85 and beyond.
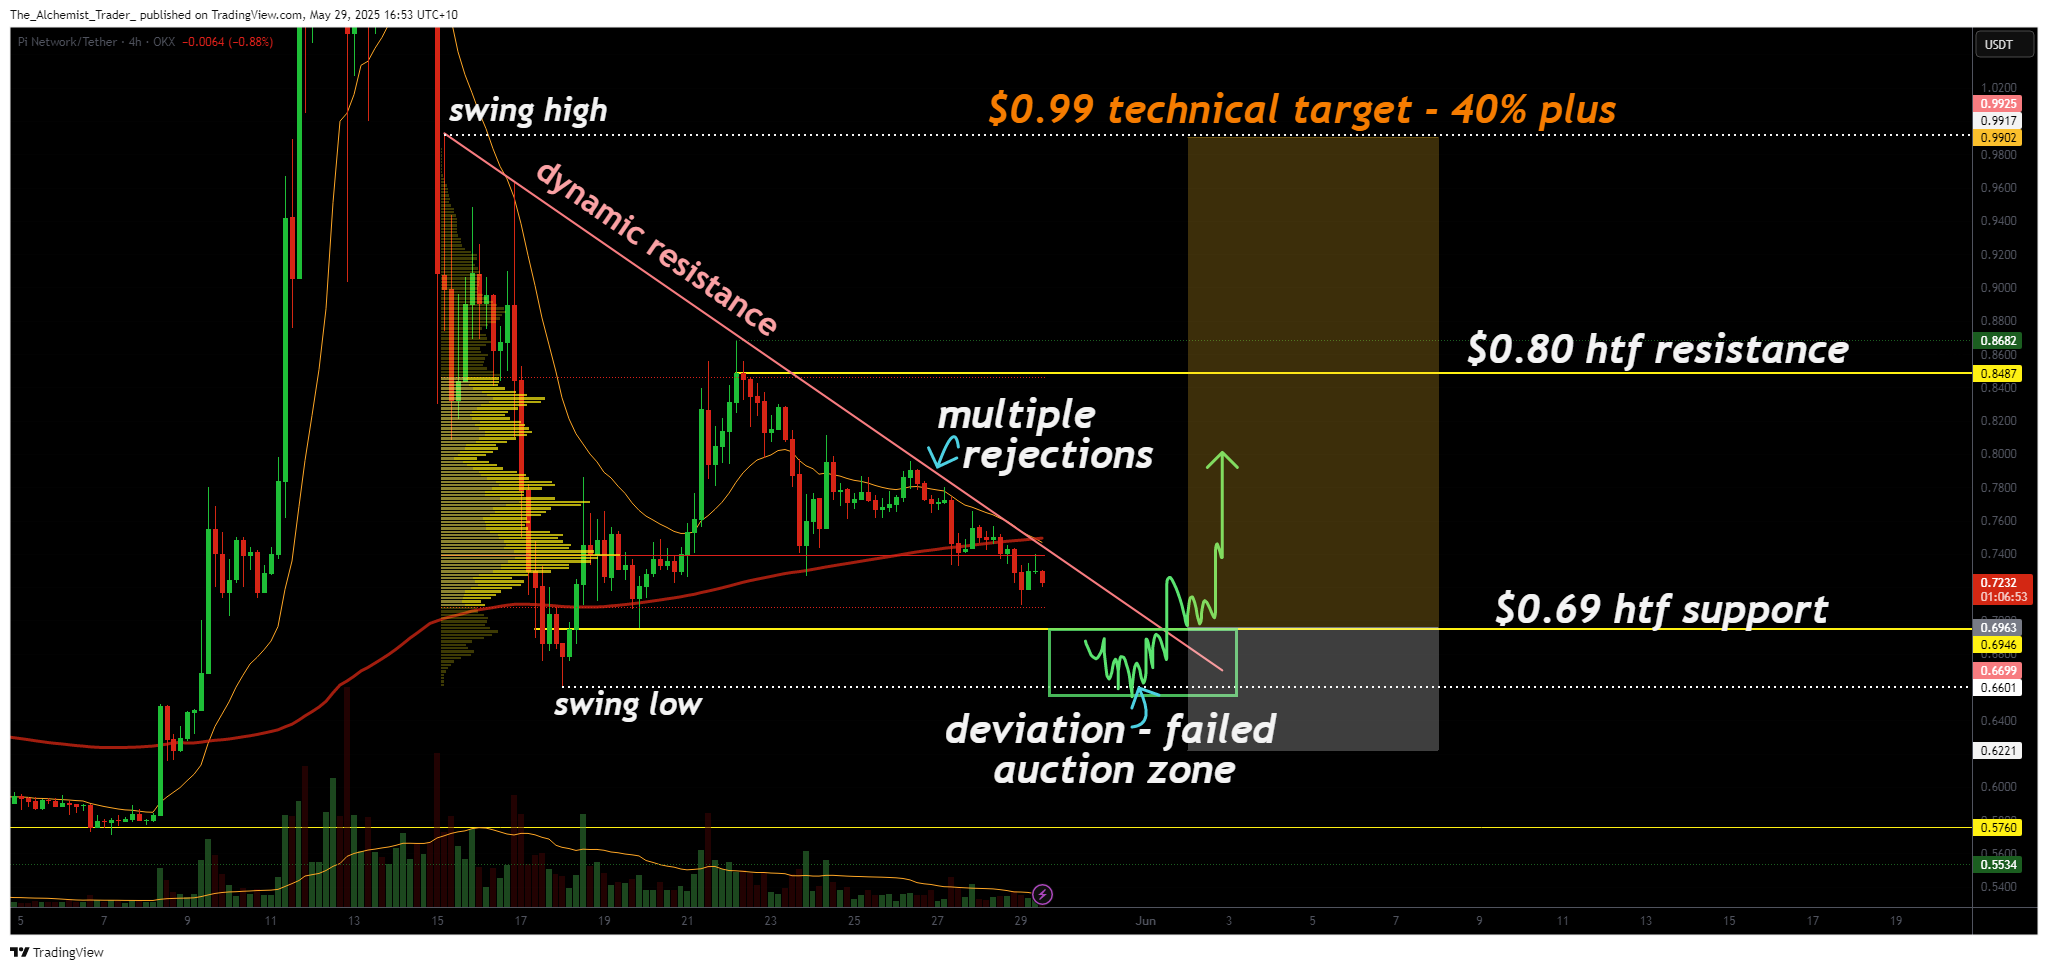 PiNetwork (4H) Chart, Source: TradingView
This compression of price into a narrowing zone, wedged between dynamic resistance and high-timeframe support, has formed a classic apex structure. These setups often precede high-volatility moves, as price eventually breaks out of the contracting range. What makes this scenario particularly compelling is that it’s unfolding at a high-confluence support level, suggesting that buyers may soon overpower sellers.
The support zone around $0.69–$0.70 aligns with the 0.618 Fibonacci level, a popular retracement used by traders to gauge bullish continuation zones. This same area also overlaps with VWAP SR and the value area low of the current volume range. From a technical standpoint, this confluence makes it a high-probability trade location, ideal for forming a potential higher low or failed auction.
The failed auction setup becomes more probable given the decreasing volume profile. When volume tapers off as price approaches support, it typically means that sellers are becoming exhausted. Once selling pressure subsides and a surge of buy-side volume enters the market, it can trigger a quick reversal. If Pi Network reclaims the $0.74 point of control (the midpoint of the range), this will confirm demand absorption and set up the next leg toward $0.85 and $0.99.
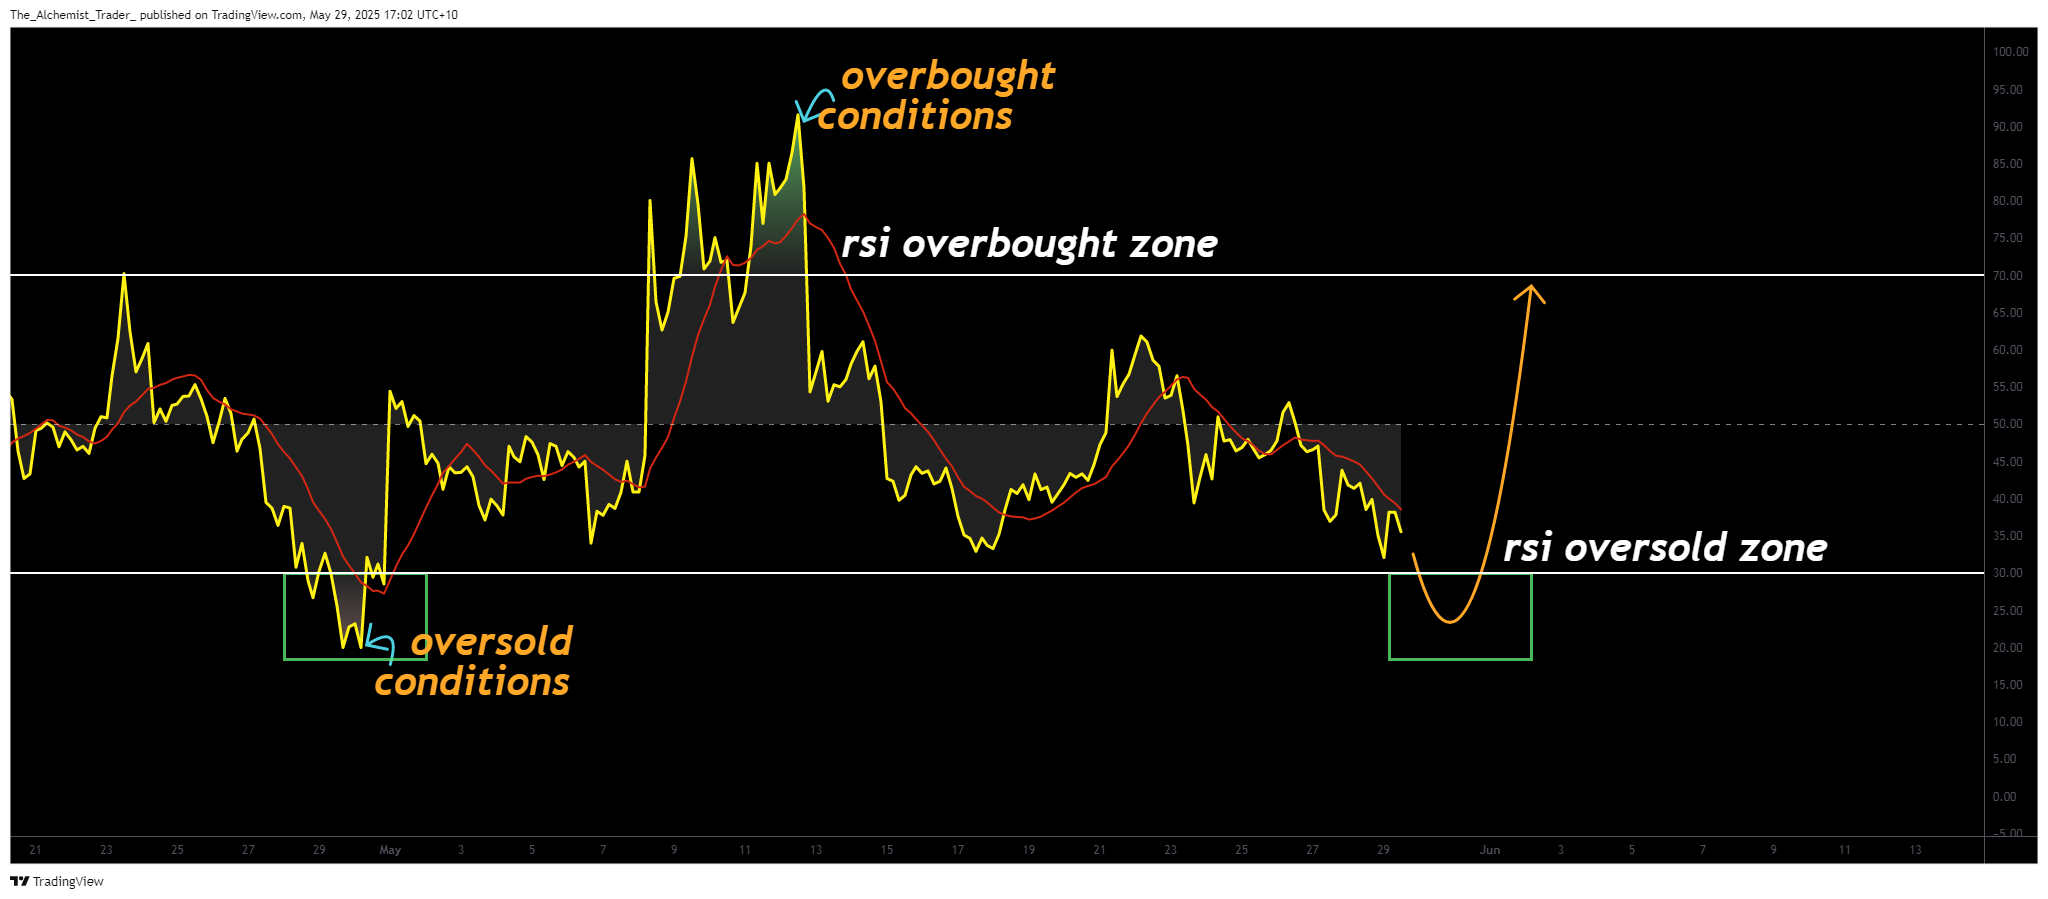 PiNetwork RSI Conditions, Source: TradingView
The RSI, currently trending toward 30, also paints a bullish setup. Historically, Pi Network has responded to oversold RSI conditions with sharp reversals—often pushing back into the 70–90 range in prior cycles. These moves have typically coincided with failed breakdowns and deviations around high-confluence support levels. A similar sequence now appears to be unfolding. This alignment of RSI oversold conditions with strong support adds further weight to the bullish reversal narrative.
Volume remains the missing component, but that’s expected. A decline in volume at support is typical before a breakout, as market participants await confirmation. The key signal will be a sudden increase in volume accompanying a reclaim of the point of control. This shift would suggest a reversal is underway and that buyers have regained control of market direction. When combined with RSI reversal and technical pattern breakout, this would be a powerful signal for continuation.
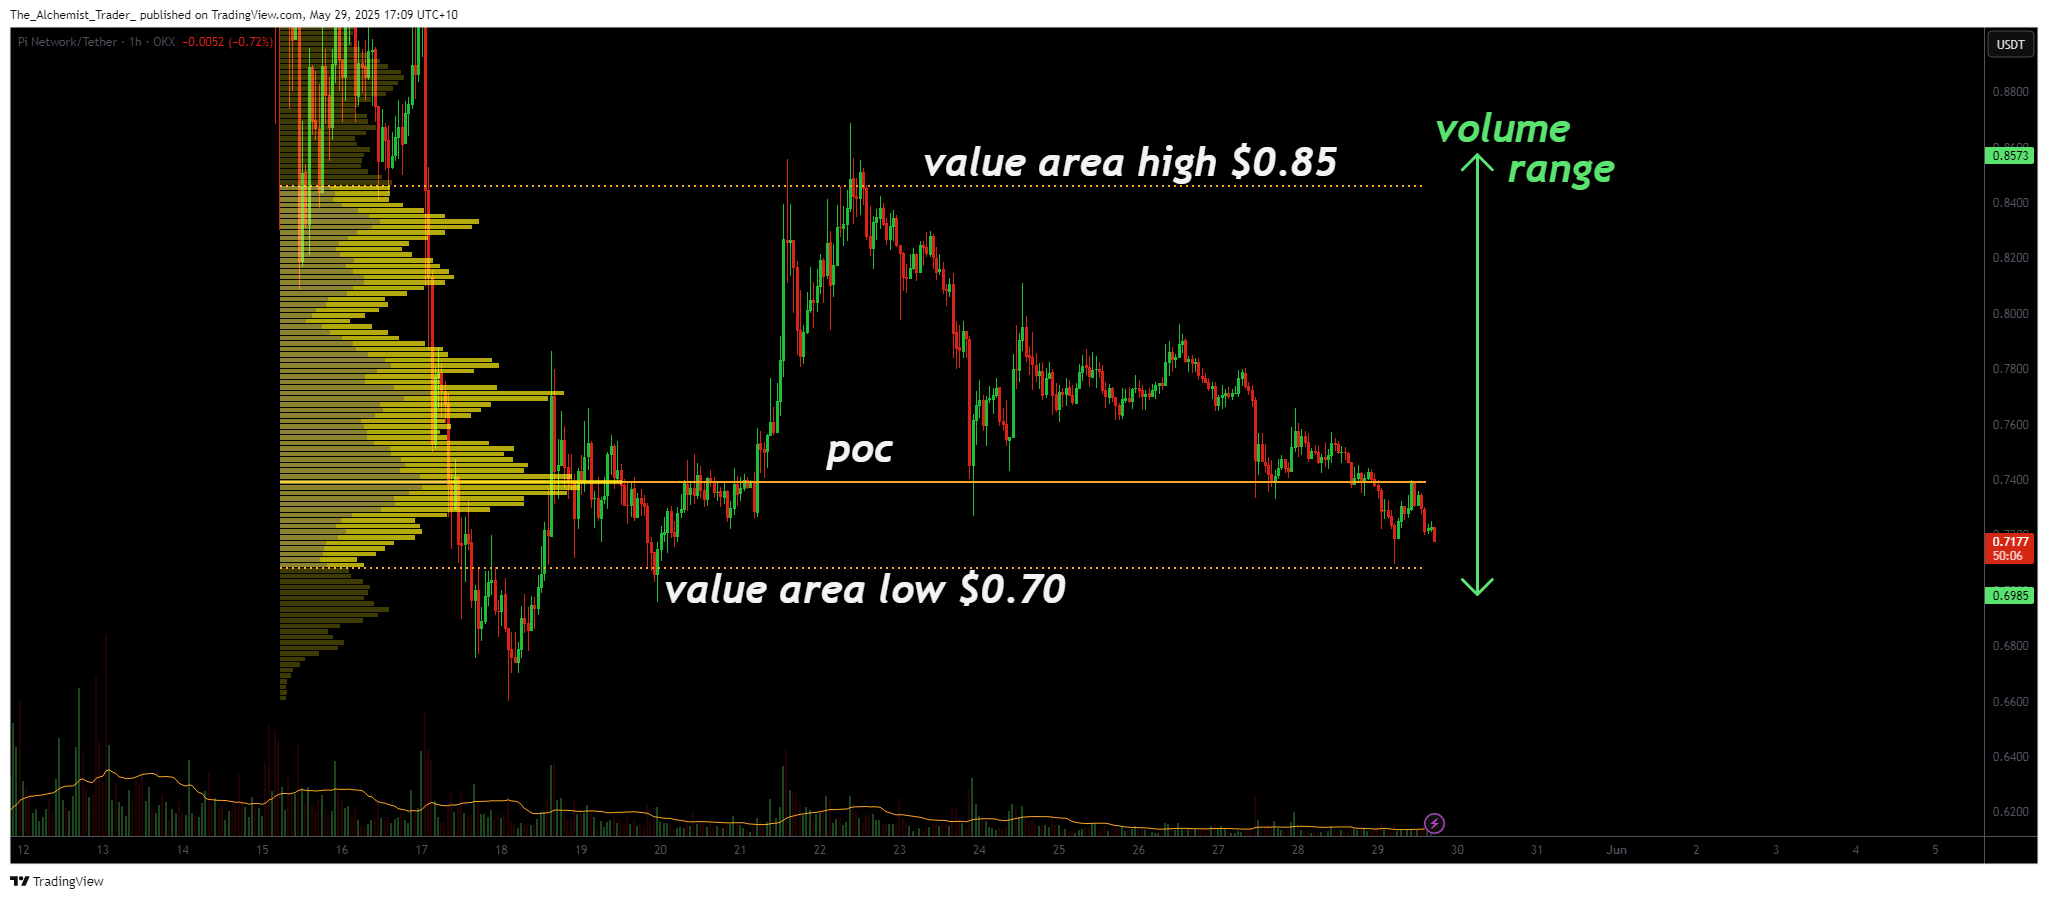 PiNetwork (4H) Chart, Source: TradingView
The broader volume range also supports the case for a full rotation. The current structure spans from the value area low ($0.70) to the value area high ($0.85), with $0.74 acting as the point of control. In past cycles, Pi Network has exhibited clean rotations within such ranges, especially after reclaiming POC levels following failed auctions. This would imply a move from $0.70 back to $0.85, and eventually to $0.99, if momentum and volume support the trend.
What’s important to highlight here is the holistic alignment of multiple indicators: Fibonacci support, RSI conditions, dynamic pattern structure, volume range theory, and historical context. When these elements combine at a clear technical level, it creates a high-conviction setup. The downside risk remains contained above $0.66, and the upside potential, should a reversal occur, is significant.
If the current level breaks with conviction and a bearish retest confirms the breakdown, this would invalidate the bullish structure. But until that happens, the market leans toward a corrective pullback in a still-intact bullish macro structure. The longer price consolidates without breaking down, the more likely it becomes that a reversal is forming.
What to expect in the coming price action
As long as Pi Network holds above $0.69 support and volume enters the market, a reclaim of the $0.74 point of control would signal a bullish shift.
From there, expect rotation toward $0.85, followed by a potential rally to $0.99. This would complete a full value range rotation and mark a continuation of the larger bullish trend. With RSI nearing oversold and volume building quietly, Pi Network may be nearing its next impulsive move.


 English (US) ·