On April 25, POL marked its fifth day of gains, breaking a prolonged downtrend as ecosystem momentum and NFT demand picked up.
According to crypto.news, Polygon’s native token, POL (formerly MATIC), surged nearly 20% to an intraday high of $0.26, pushing weekly gains to 34% and marking a 70% rebound from its monthly lows. Its market cap has once again crossed the $2 billion mark, standing at around $2.15 billion at the time of writing.
A sharp rise in trading activity backed this rally. POL’s 24-hour volume also shot up 270% to over $340 million, signaling increased buying pressure. Meanwhile, interest from derivative traders is also on the rise, with open interest in POL futures climbing 25% to $107 million in the last day alone.
The latest price surge appears to be closely tied to the launch of the Agglayer Breakout Program, Polygon’s new initiative aimed at incubating high-impact projects that build on Agglayer and Polygon.
The program supports early-stage blockchain startups with funding and dev resources while directly directly rewards POL stakers with token airdrops ranging from 5% to 15% of a project’s token supply from graduating projects.
Notably, two standout projects, Privado ID and Miden, are already preparing their own drops. Privado ID is allocating around 5%, and Miden plans to airdrop 10% of its tokens to POL stakers.
The rally also comes amid an uptick in demand for NFTs on Polygon. A recent report from crypto.News shows that NFT sales on Polygon (POL) reached $22.1 million in the seven days leading up to April 22, surpassing Ethereum (ETH), which brought in $21.8 million during the same period.
As of press time, Polygon is also outpacing other platforms in terms of the number of buyers. Over the past week, 47,592 people bought NFTs on Polygon, a noticeable increase of roughly 62%. In comparison, Ethereum had 39,498 buyers per data from CryptoSlam.
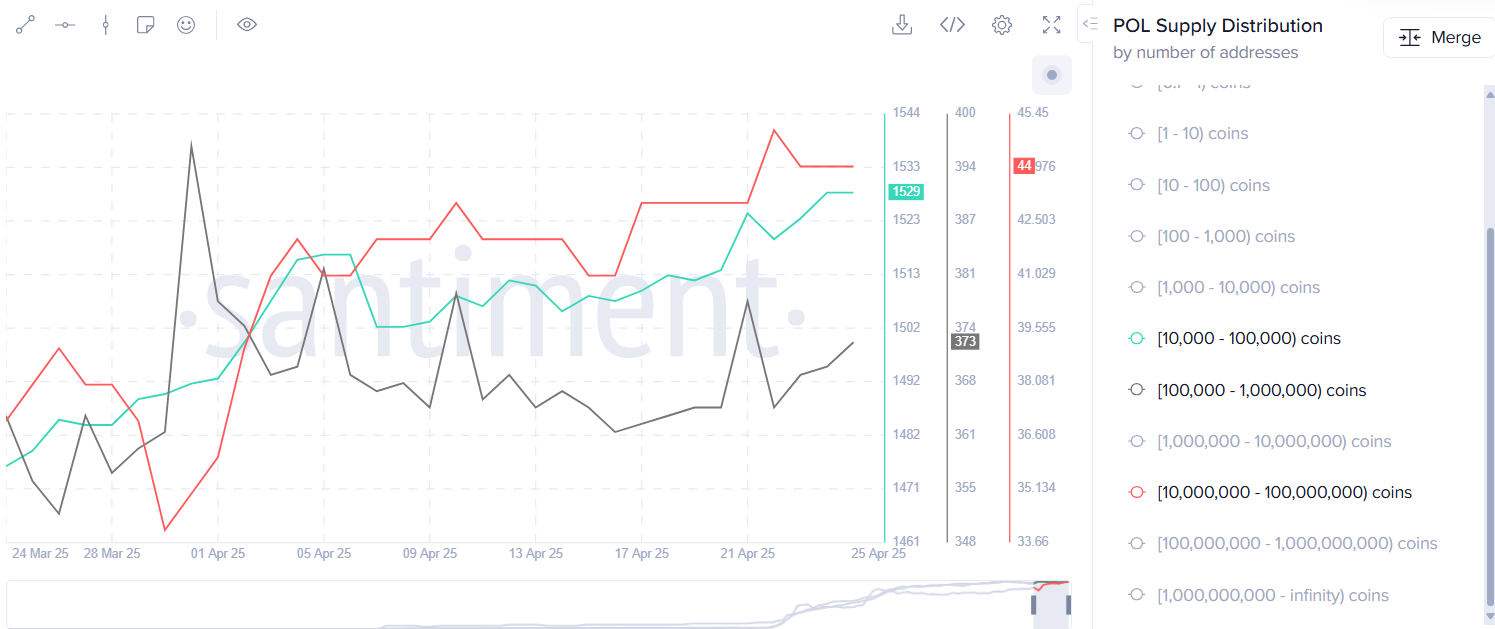 Source: Santiment
The rising bullish sentiment among its investors is also evident in a steady increase in the number of wallets holding between 10,000 and 100 million POL tokens. That suggests whales and mid-sized holders are accumulating, possibly expecting more upside.
POL price analysis
On the daily chart, POL has broken out above the upper trendline of a long-term descending pattern that began in December 2023. This kind of breakout often signals the start of a trend reversal, and the momentum looks strong.
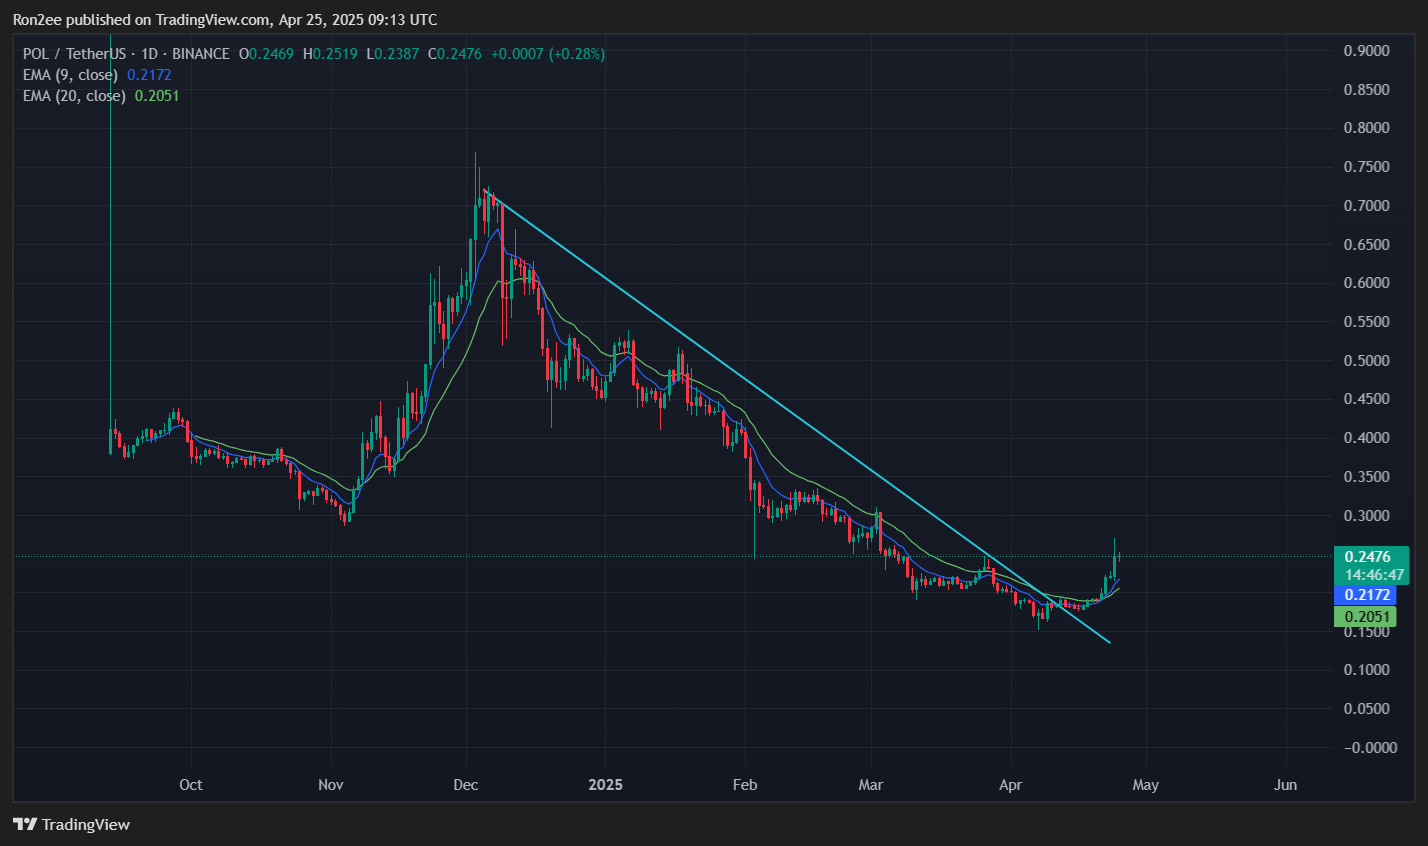 POL price, 9-day and 20-day EMA — April 25 | Source: crypto.news
It also formed a golden cross on the daily timeframe, with the 9-day EMA moving above the 20-day EMA for the first time since November 2024. Back then, this signal flashed just before POL went on a 112% rally within a month, climbing from $0.34 to $0.71. If history repeats, a similar upside move could be on the cards.
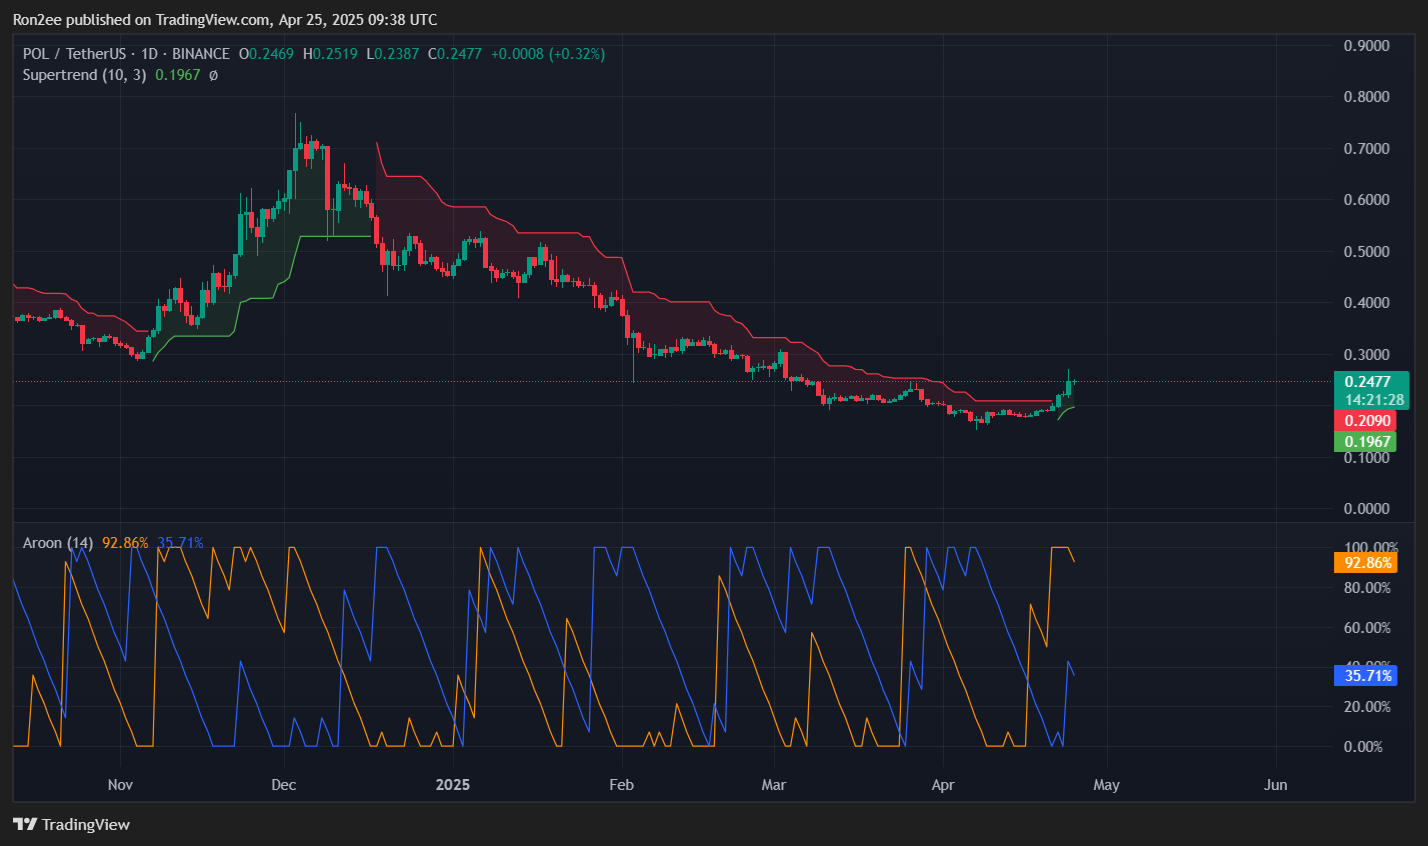 POL Aroon and Supertrend chart — April 25 | Source: crypto.news
Momentum indicators are leaning bullish, too. The Aroon Up is at 92.86% while the Aroon Down sits at 35.71%, showing clear dominance by buyers. The Supertrend indicator has also flashed a buy signal, with its green support line appearing below the price for the first time since last December.
With the current momentum in play, analysts have started to line up bullish targets. For instance, Man of Bitcoin pointed out that POL is currently in the third wave of an Elliott Wave pattern and has just hit the 1.618 Fibonacci extension, typically where wave-3 peaks. A healthy wave-4 pullback could come next, with support between $0.241 and $0.217.
Meanwhile, Mohamed G. Sewid believes this bounce might be the start of a massive bull run, possibly ending a 3-year corrective wave. As long as the $0.151 low holds, he says, POL could be eyeing a return to all-time highs, especially if it clears the $0.768 mark.
Disclosure: This article does not represent investment advice. The content and materials featured on this page are for educational purposes only.


 English (US) ·