 1 month ago
21
1 month ago
21
XRP has finally come alive after a prolonged period of consolidation and underperformance relative to other major crypto assets. Over the past two weeks, Ripple’s token has broken out from long-standing patterns against both USD and BTC, shifting market structure and flipping critical resistances into support.
The breakout is not only technical, it’s aggressive, with surging momentum and elevated RSI levels, hinting at the return of speculation and perhaps early signs of a narrative forming around XRP again. But how sustainable is this rally?
Technical Analysis
By ShayanMarkets
The USDT Pair
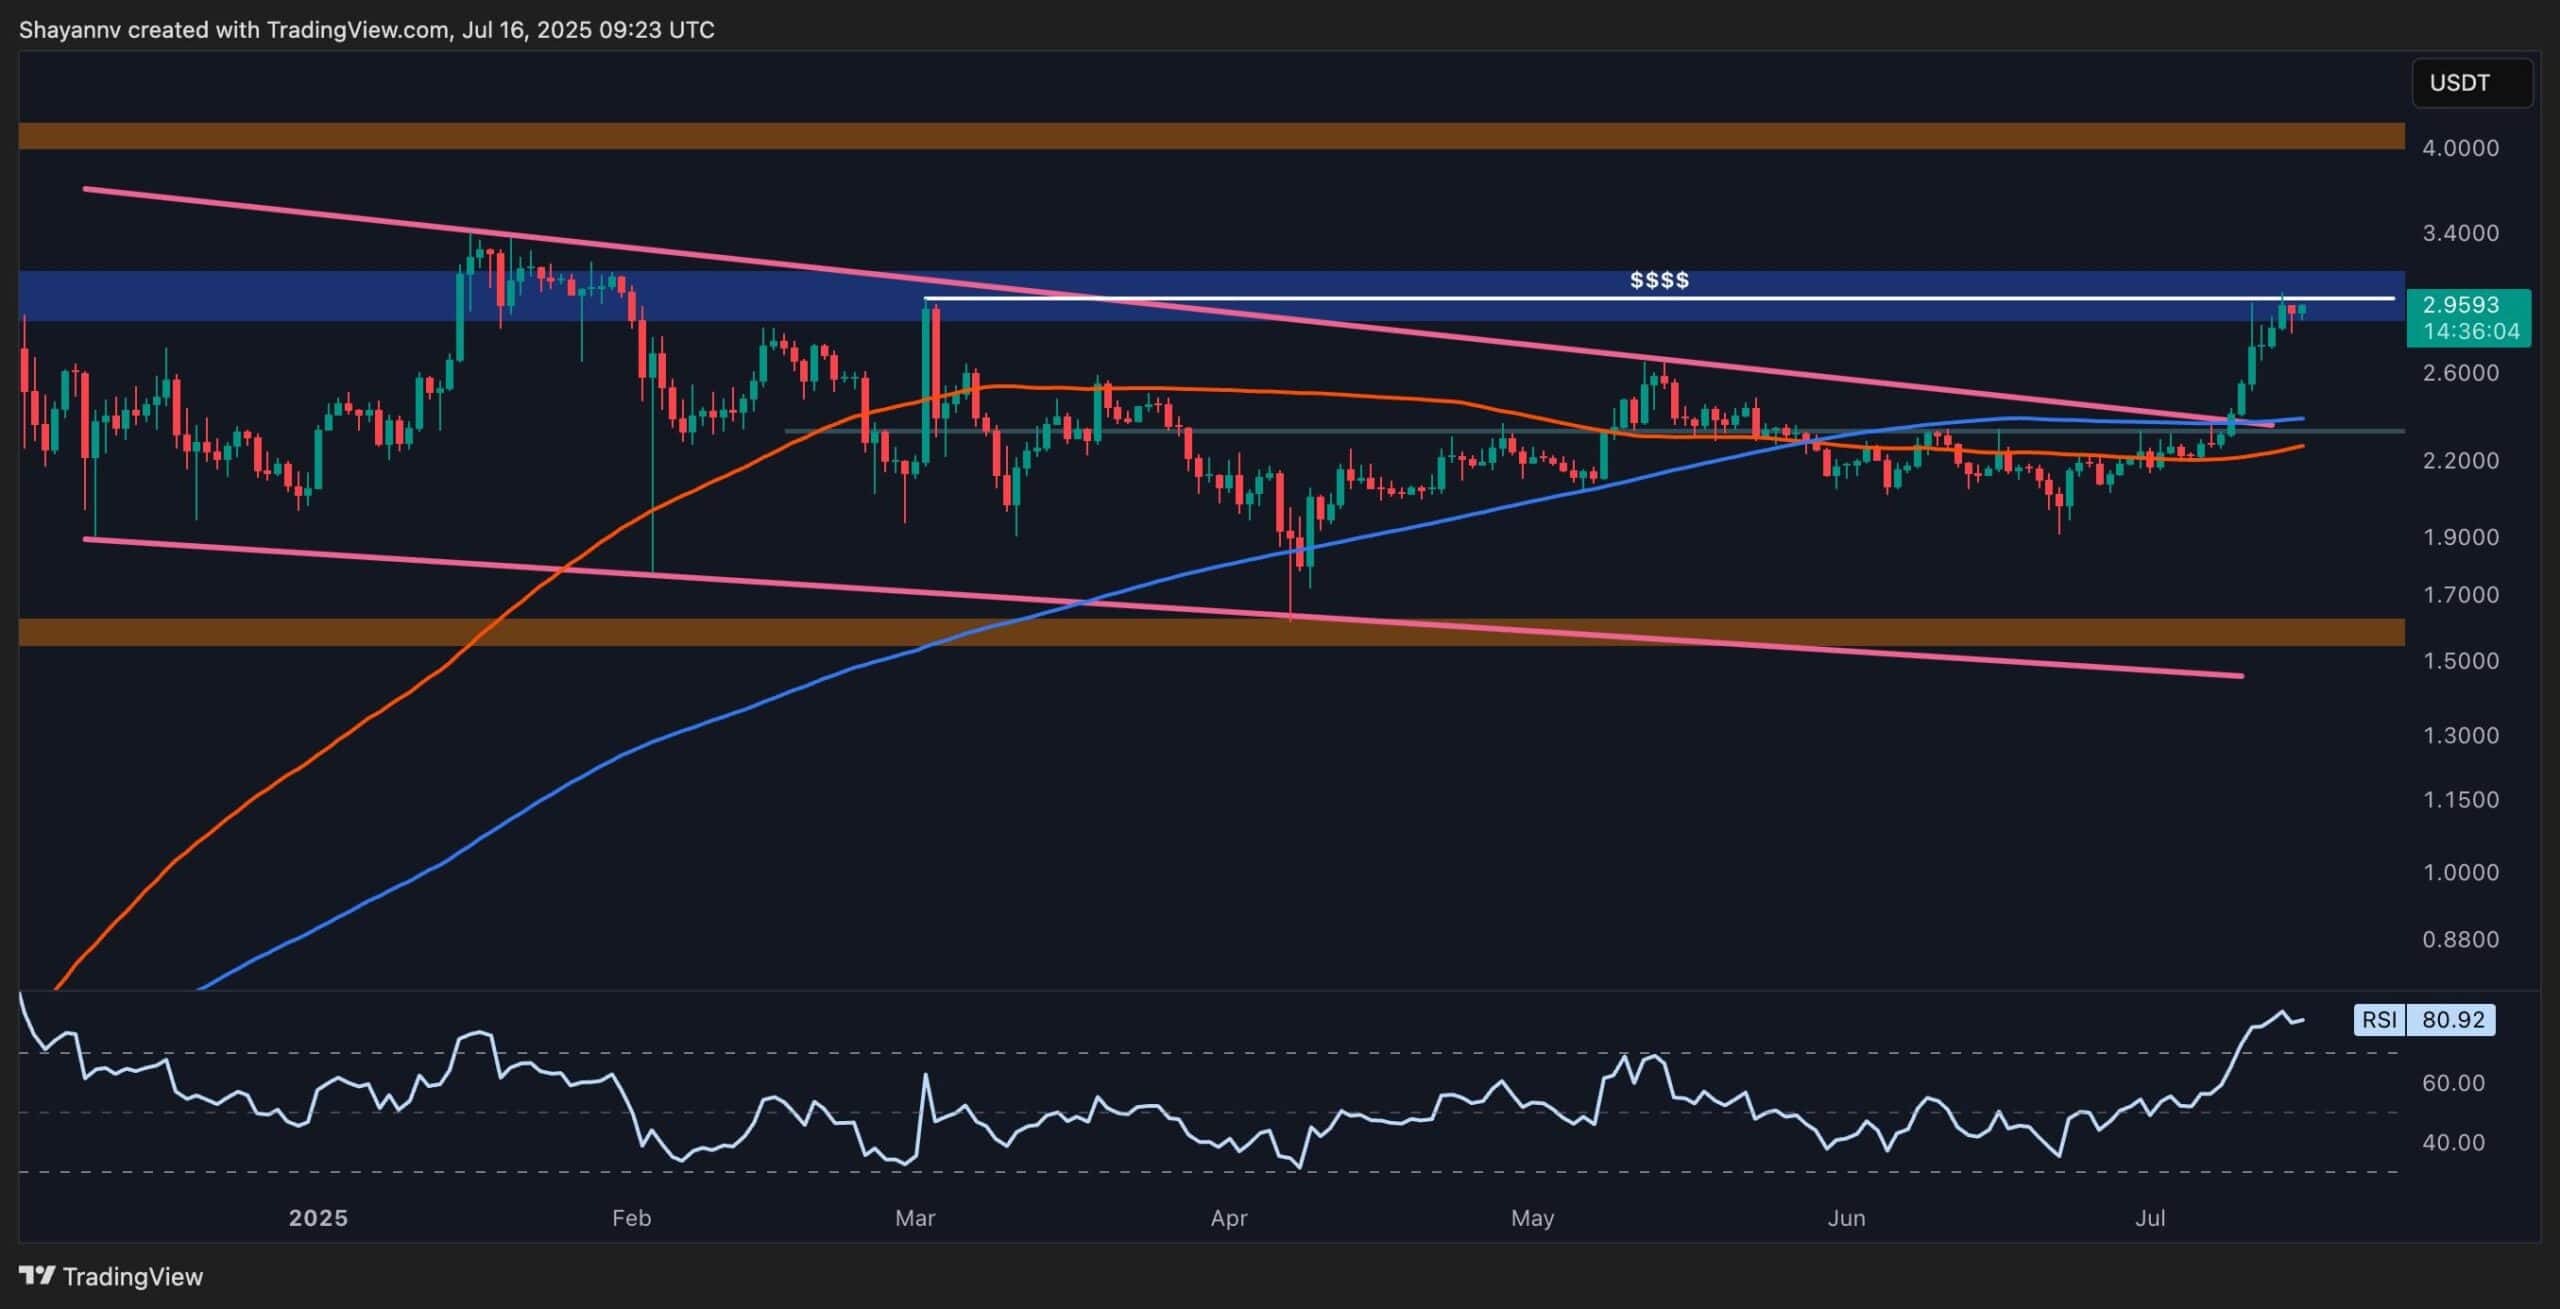
The XRPUSDT chart is showing a powerful breakout above $2.30 after months of sideways action. The price broke out of a falling wedge pattern that had been forming since late 2024.
The wedge breakout was accompanied by a strong bullish candle that closed well above the 50-day and 200-day moving averages, both located around the $2.30 zone. XRP is now pushing into a major resistance area at $3.00, a zone that previously acted as a supply ceiling multiple times during the past year.
The rally has been sharp, and the RSI has entered extremely overbought territory at 80. Historically, such RSI spikes have led to corrections or sideways consolidation before continuation. As long as XRP holds above the 100-day and 200-day moving averages in the coming days, the path toward $3.40 and even $4.00 opens up. However, a close below the MAs could trigger profit-taking and drag the price back below $2.00.
The BTC Pair
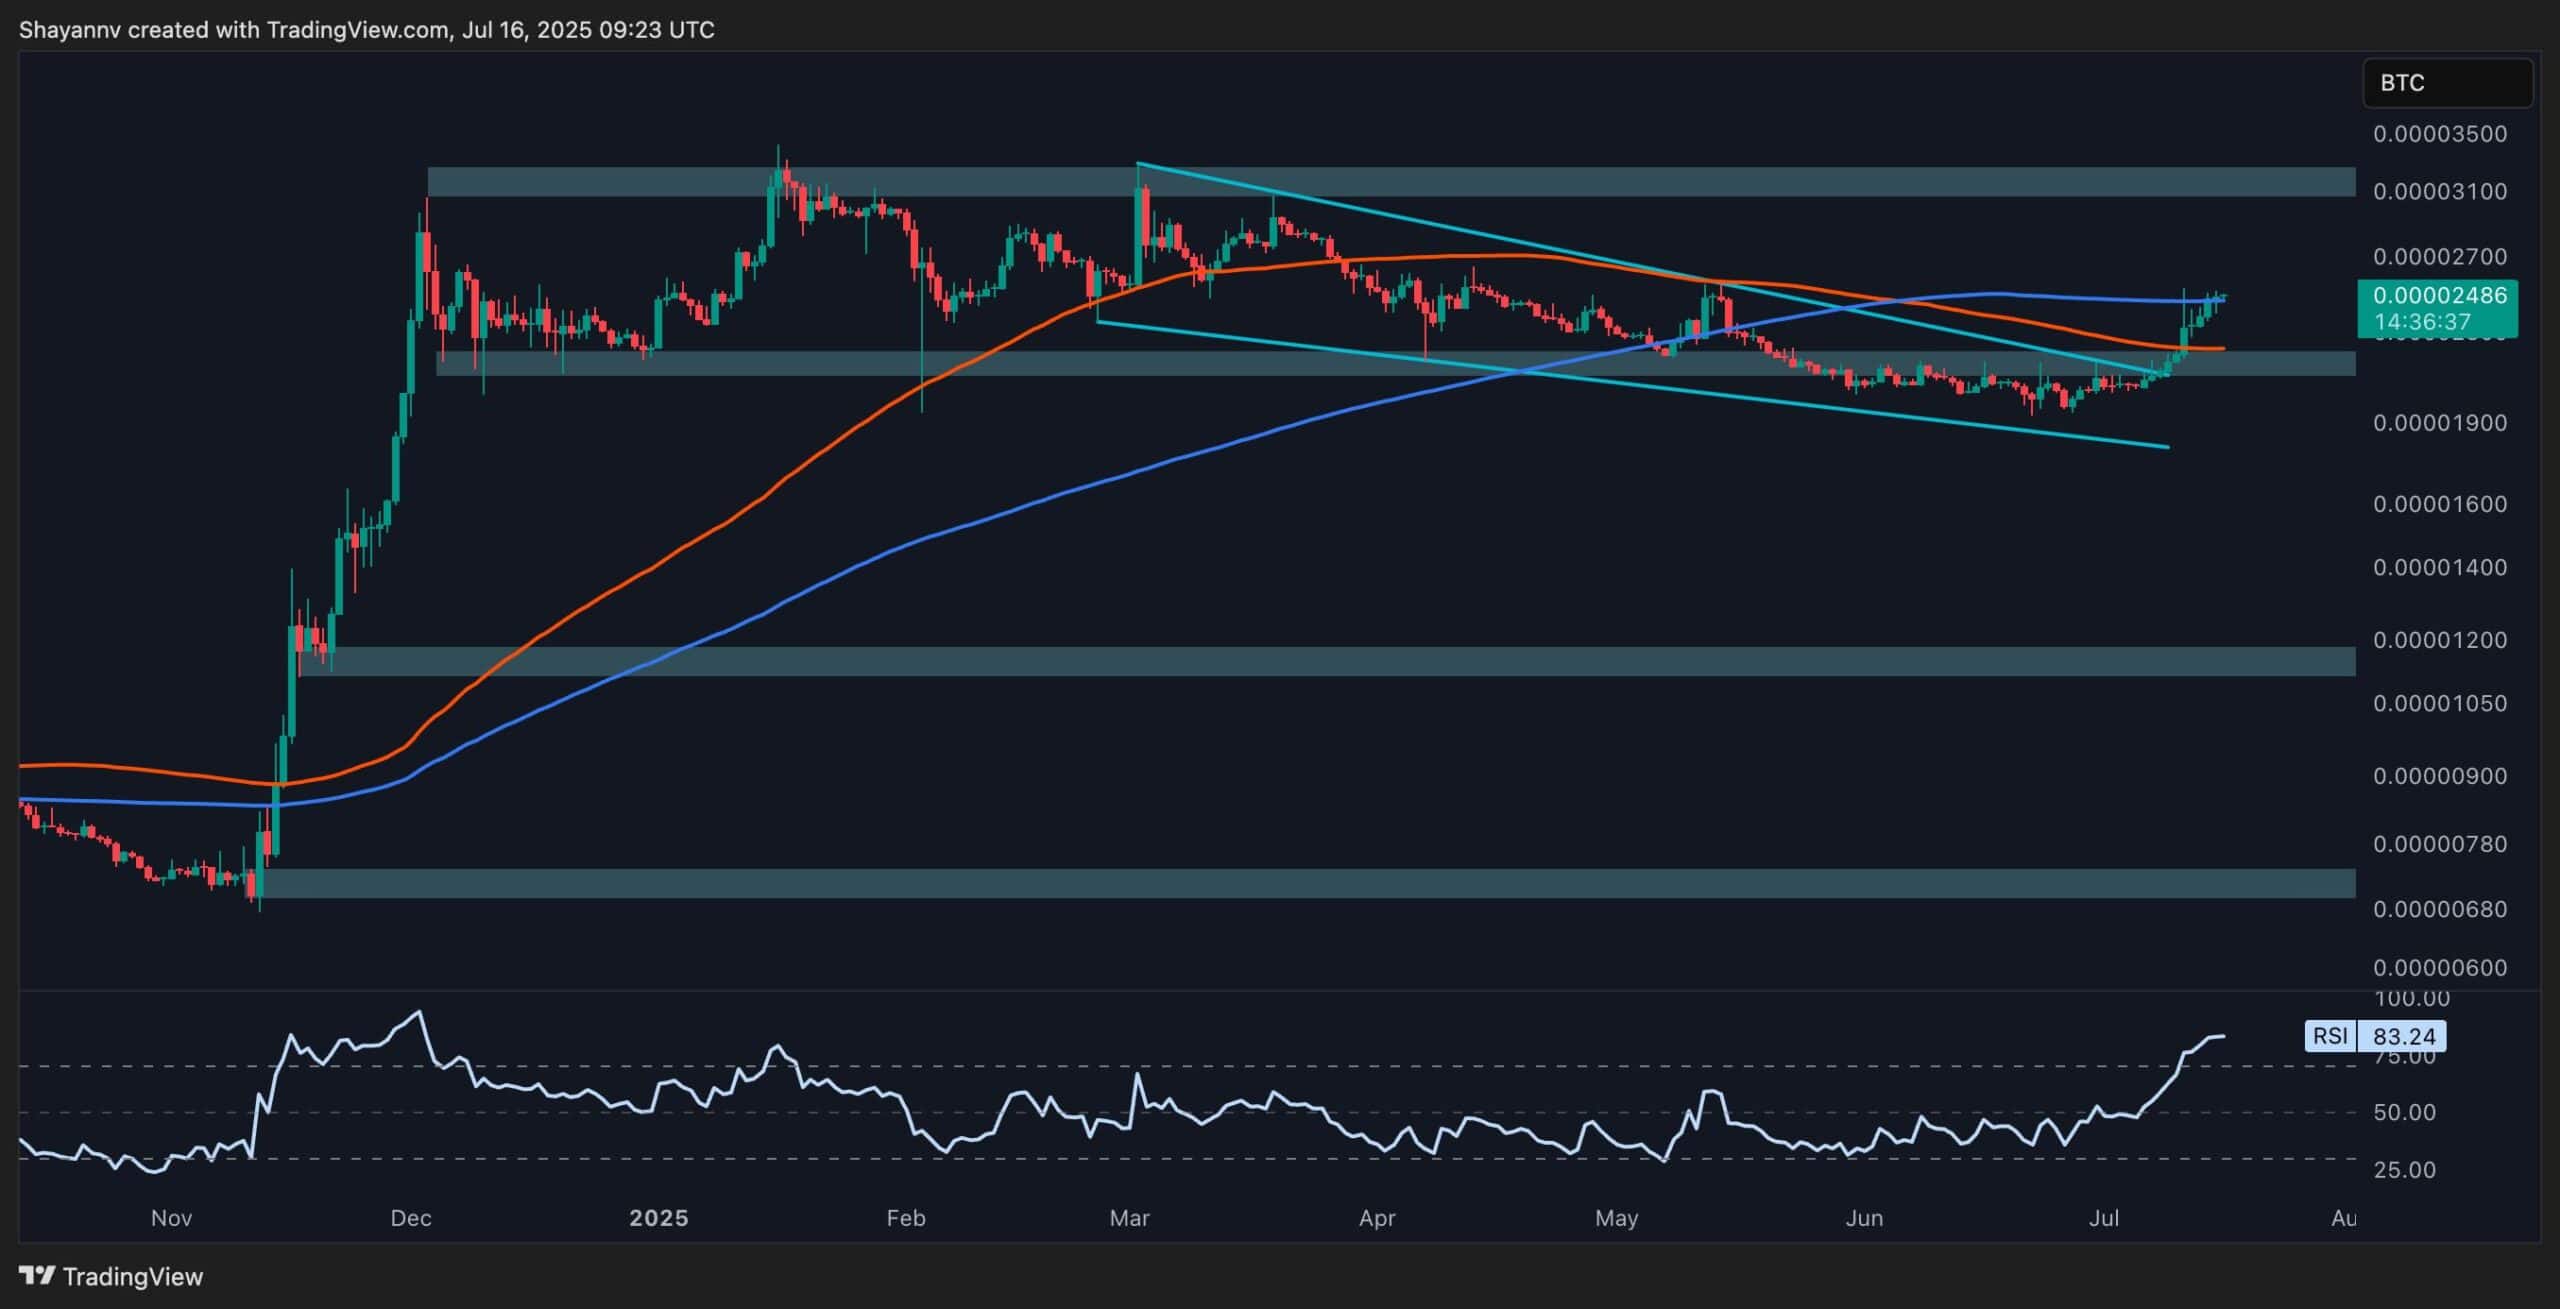
The XRP/BTC pair also confirms this momentum shift. The price has broken out of a falling wedge structure and flipped the key 2,200 SAT range into support. This is significant, as XRP had been trending downward against BTC for the majority of 2025. The breakout invalidates the bearish market structure and suggests a new trend phase could be developing.
Currently sitting around 2,500 SAT, XRP/BTC is testing its 200-day moving average and is trying to make higher highs and higher lows above it. Moreover, the RSI on this pair is also overbought at 83, suggesting the rally may be overextended in the short term.
The next significant resistance lies around 3,100 SAT, a zone that acted as a major distribution region during XRP’s last bullish leg. If XRP/BTC can consolidate above the 2,400 SAT level, the buyers will likely aim for this zone in the next impulse.
Binance Free $600 (CryptoPotato Exclusive): Use this link to register a new account and receive $600 exclusive welcome offer on Binance (full details).
LIMITED OFFER for CryptoPotato readers at Bybit: Use this link to register and open a $500 FREE position on any coin!
Disclaimer: Information found on CryptoPotato is those of writers quoted. It does not represent the opinions of CryptoPotato on whether to buy, sell, or hold any investments. You are advised to conduct your own research before making any investment decisions. Use provided information at your own risk. See Disclaimer for more information.
Cryptocurrency charts by TradingView.


 English (US) ·