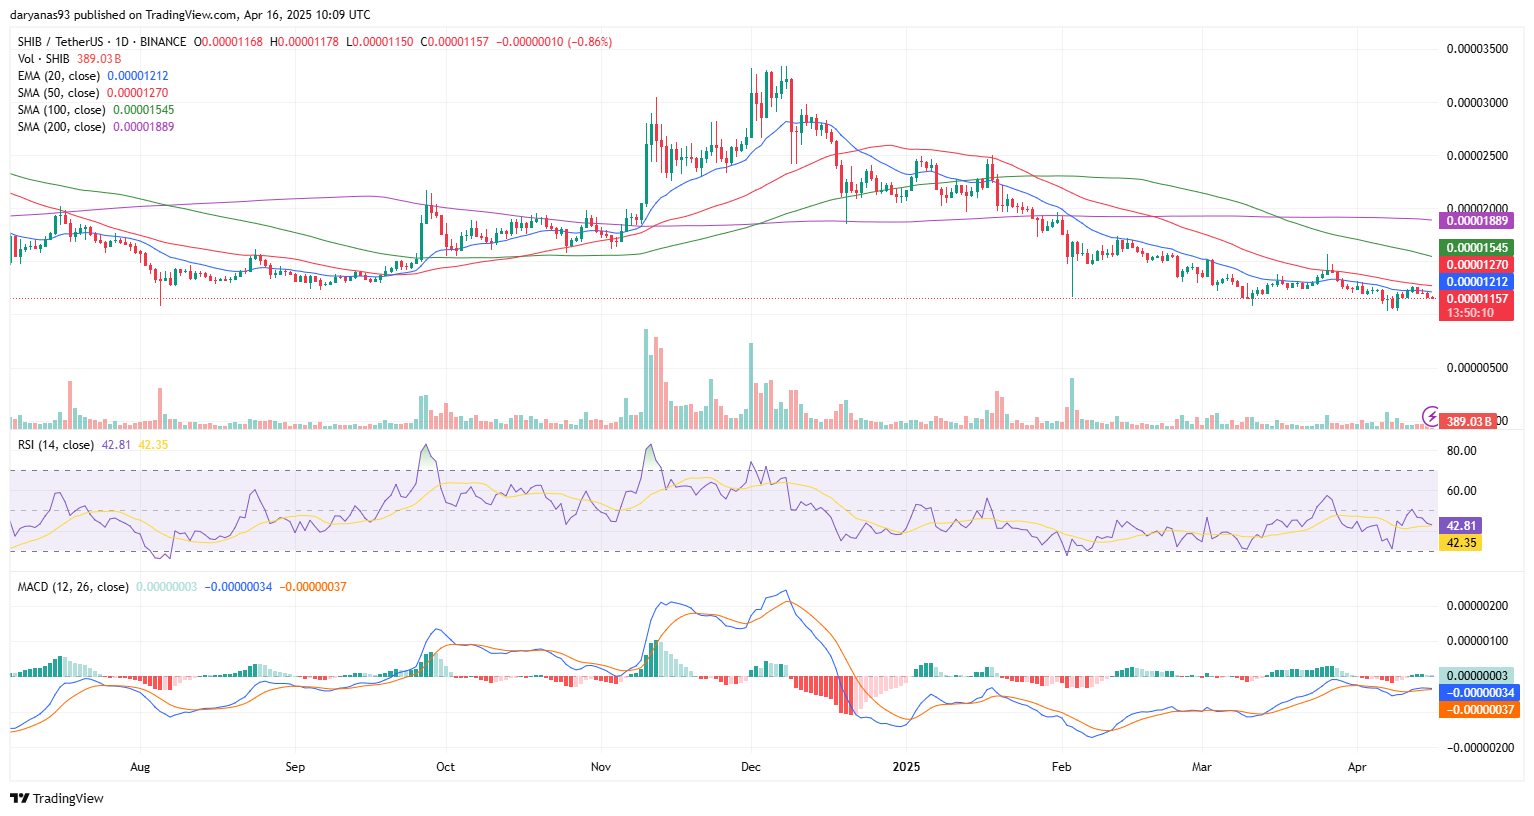
SHIB and XRP are both testing historically significant support zones, with technical indicators hinting at a potential shift in momentum as traders watch for key breakout levels to confirm a trend reversal.
Shiba Inu (SHIB) is currently trading at $0.00001157, which is within a historically significant support zone around the $0.00001150–$0.00001250. This level has been tested multiple times and acted as major support throughout the consolidation phase between August to September last year, suggesting it’s an important line of defense for buyers.
Even though the overall trend is still bearish, with SHIB price trading below all key moving averages, momentum indicators reflect a slight cooling of bearish pressure. The Relative Strength Index is hovering around 42.81, neither oversold nor strong, suggesting weak bearish momentum but also room for recovery. RSI has also been flat-lining, which often precedes a bounce—especially when paired with key support. The MACD histogram is flat, indicating that selling pressure may be losing steam.
A break above the $0.00001212–$0.00001270 resistance cluster, which includes the 20-day EMA and approaches the 50-day SMA, would be the first meaningful signal of strength. This range previously acted as support multiple times last year, particularly between August and October, before it broke and flipped into resistance, making it a key support-turned-resistance area. Once this is cleared, it opens the door toward the $0.00001545 area (100-day SMA) as the next upside target.
 Source: TradingView
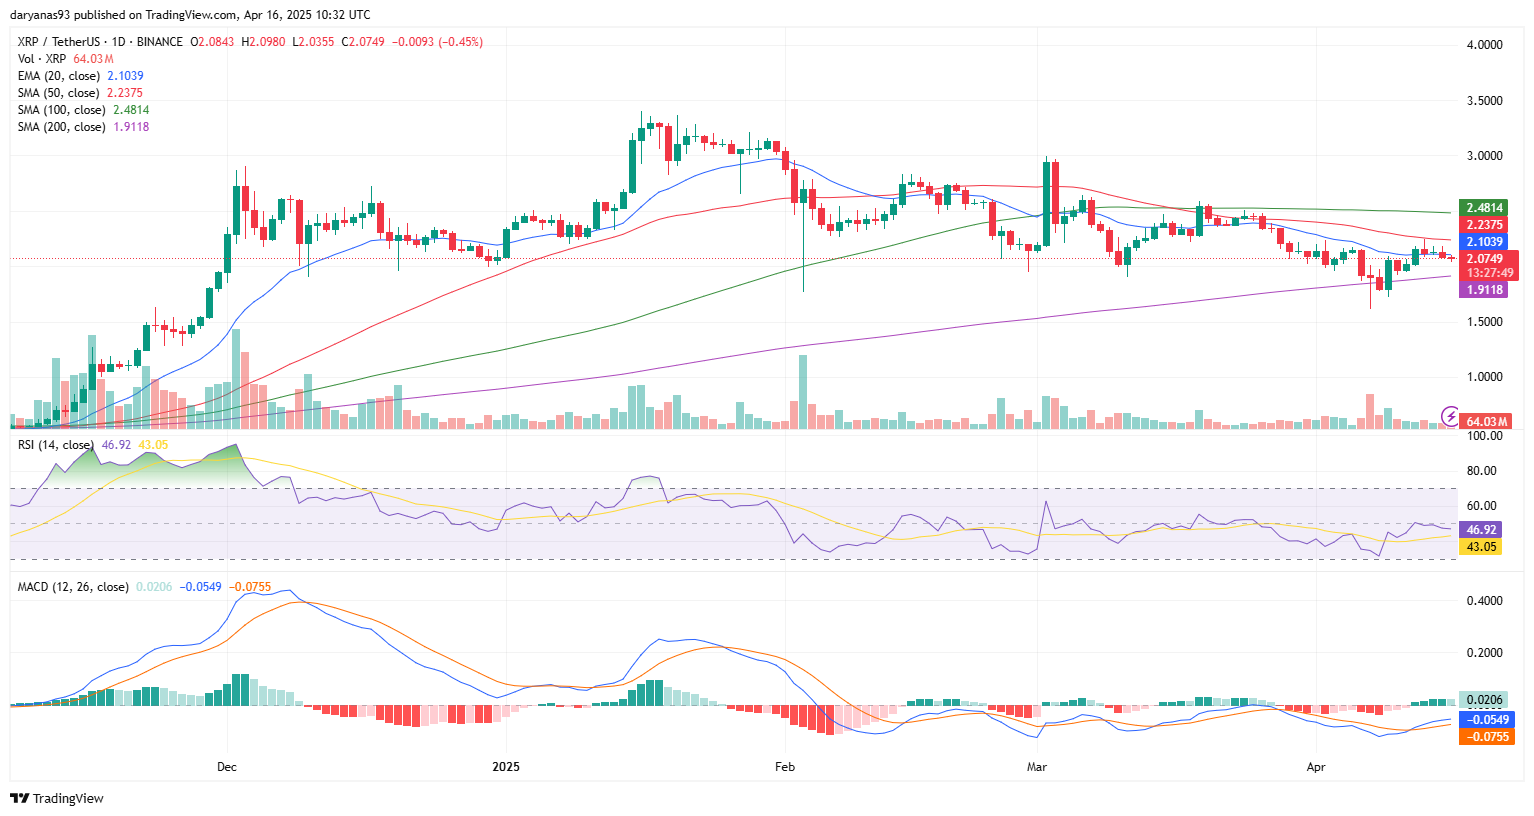
Ripple (XRP) is currently trading at $2.0749, the level which acted as support in mid-to-late December last year, before it broke out sharply into a bullish rally, reaching highs near $3 by early January.
The price also recently made a higher high and tried to reclaim 20-day Exponential Moving Average ($2.1039) and even briefly tested the 50-day Simple Moving Average ($2.2375), signaling a possible breakout effort. It also recently bounced from the 200-day SMA (at $1.9118) in a strong bullish move on April 9, marked by a large bullish candle accompanied by a notable spike in volume on that day.
The MACD line has also recently crossed above the signal line, with the histogram flipping green — an early bullish momentum signal. The RSI is at 46.92, which isn’t yet overbought, meaning there’s plenty room for the upside.
A close above $2.14–$2.23 (the 20 EMA and 50 SMA cluster) would reinforce bullish intent and potentially trigger further upside toward $2.48 (100 SMA). Similarly, analyst @Dom noted in an April 13 post on X that “$2.20 is now the only objective here,” adding that a decisive breakout above this level could pave the way for a move toward $2.50.
 Source: TradingView


 English (US) ·