Shiba Inu price has plunged into a bear market this year, shedding billions of dollars in value, and key catalysts points to more downside in the near term.
Summary
- Shiba Inu price could be at risk of a steep crash this year.
- The token’s burn rate has continued falling, partly because of Shibarium woes.
- It has formed numerous bearish patterns on the daily chart.
Shiba Inu (SHIB) token dropped to $0.0000099, down by 43% from its highest point this year and 70% below its November 2024 high.
Falling burn rate and intense whale buying
Shiba Inu, a token that was once the hottest meme coin in the crypto industry, has become a fallen angel as its market capitalization has plunged from over $20 billion in 2024 to $5.85 billion today.
Its key fundamentals suggest that it has more downside in the near term. For example, data shows that the burn rate has plunged in the past few months. It dropped by 13% on Friday to 2.57 million tokens valued at just $25.
One reason why the burn rate has plunged is that Shibarium, its layer-2 network, has largely died, with activity in the network falling to near zero. Its total value has dropped by 11% in the last 30 days to $850,000.
Shibarium’s goal was to create utility for Shiba Inu and its ecosystem, and also boost its token burn, with some of its BONE fees being converted to SHIB and incinerated.
The other major bearish catalyst for the SHIB price is that whales have continued to sell their tokens, a sign that they see the downtrend continuing. These investors have sold over 114 billion tokens in the last three weeks.
Additionally, the daily traded volume of SHIB in the futures and spot market has dropped in the past few months. CoinGecko data shows that the daily volume in the last 24 hours stood at $176 million, much lower than Pepe’s $430 million and Trump’s $1.4 billion and Pump’s $445 million.
Shiba Inu price technical analysis points to more downside
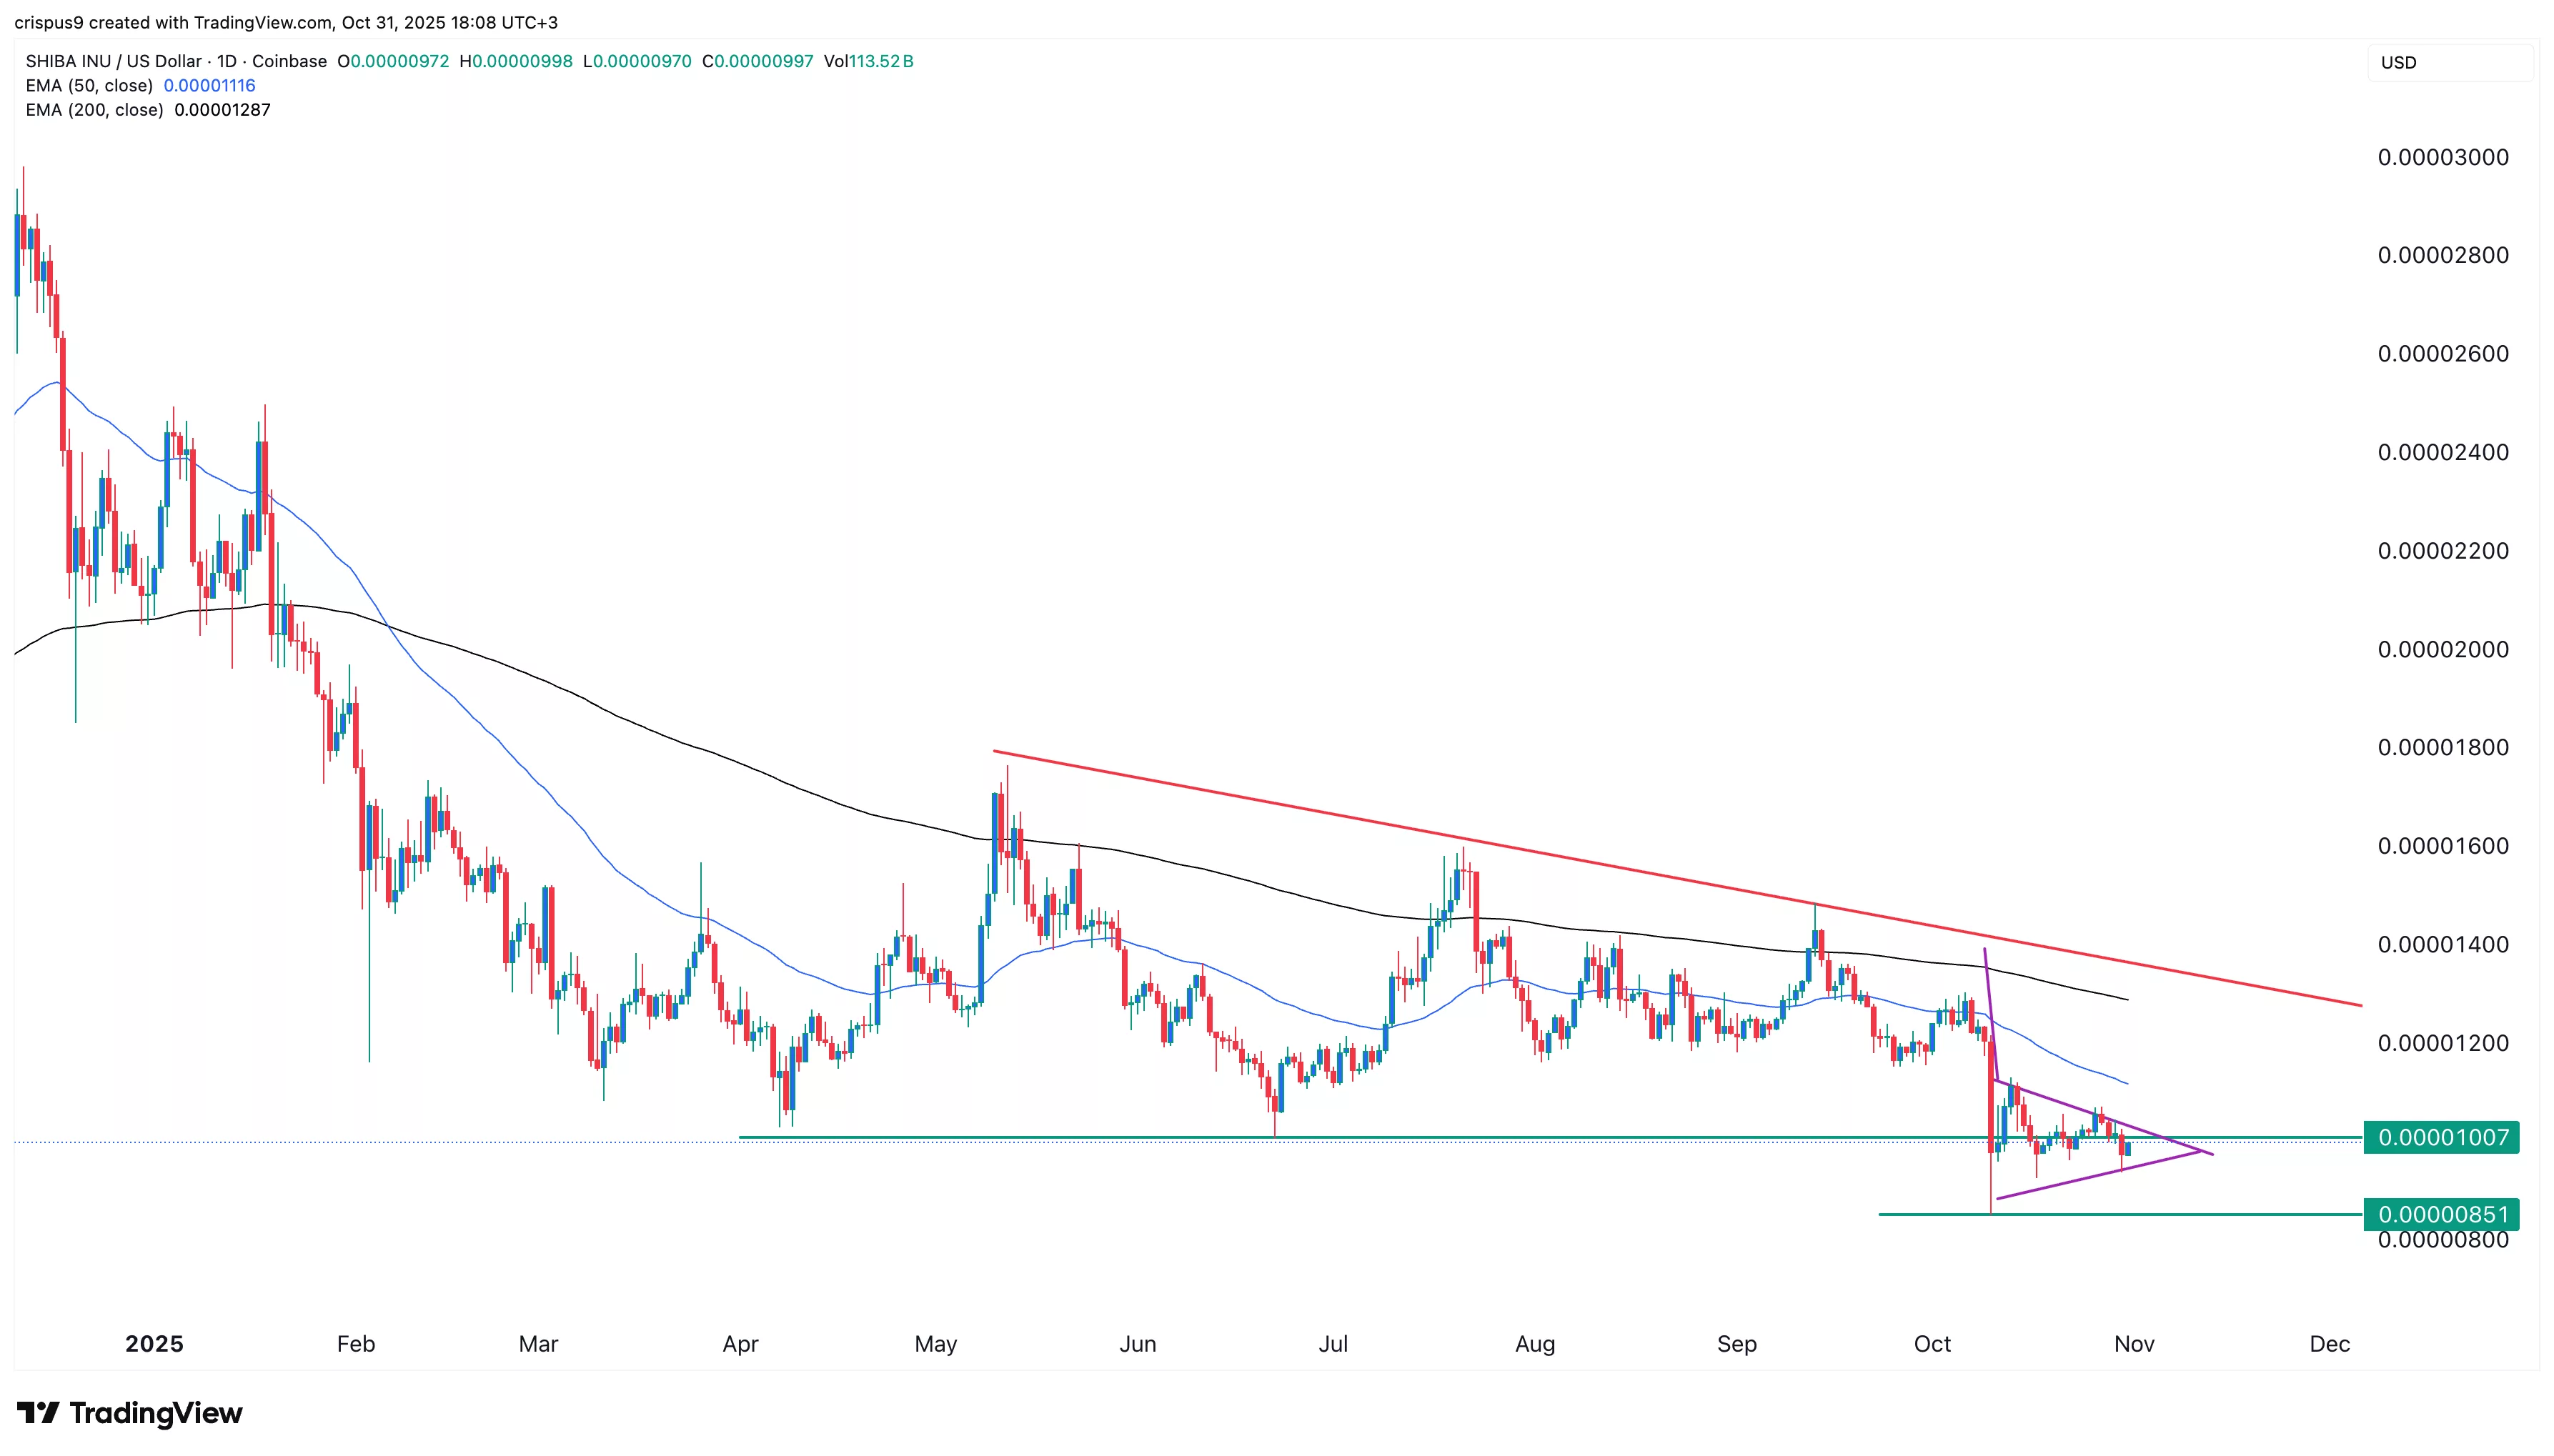
SHIB price chart | Source: crypto.news
The daily timeframe chart shows that the SHIB price has crashed in the past few months, and technicals suggest that the downtrend may continue soon.
The token has formed a descending triangle pattern, which is a common bearish continuation pattern. It is now along the lower side of this pattern.
The token has also moved below the 50-day and 200-day Exponential Moving Averages, and also formed a descending triangle pattern.
Therefore, the price may continue falling as sellers target the next key support level at $0.0000085.


 English (US) ·