Solana price remained in a tight range even after its futures open interest surged by 15%.
Solana (SOL) token was trading at $160 on Tuesday, July 15, a few points below this week’s high of $167. This consolidation is a sign that Solana’s path to $200 has faced substantial resistance.
According to CoinGlass, Solana’s futures open interest has surged to $8.8 billion, its highest level since January. This increase indicates that demand among investors remains strong.
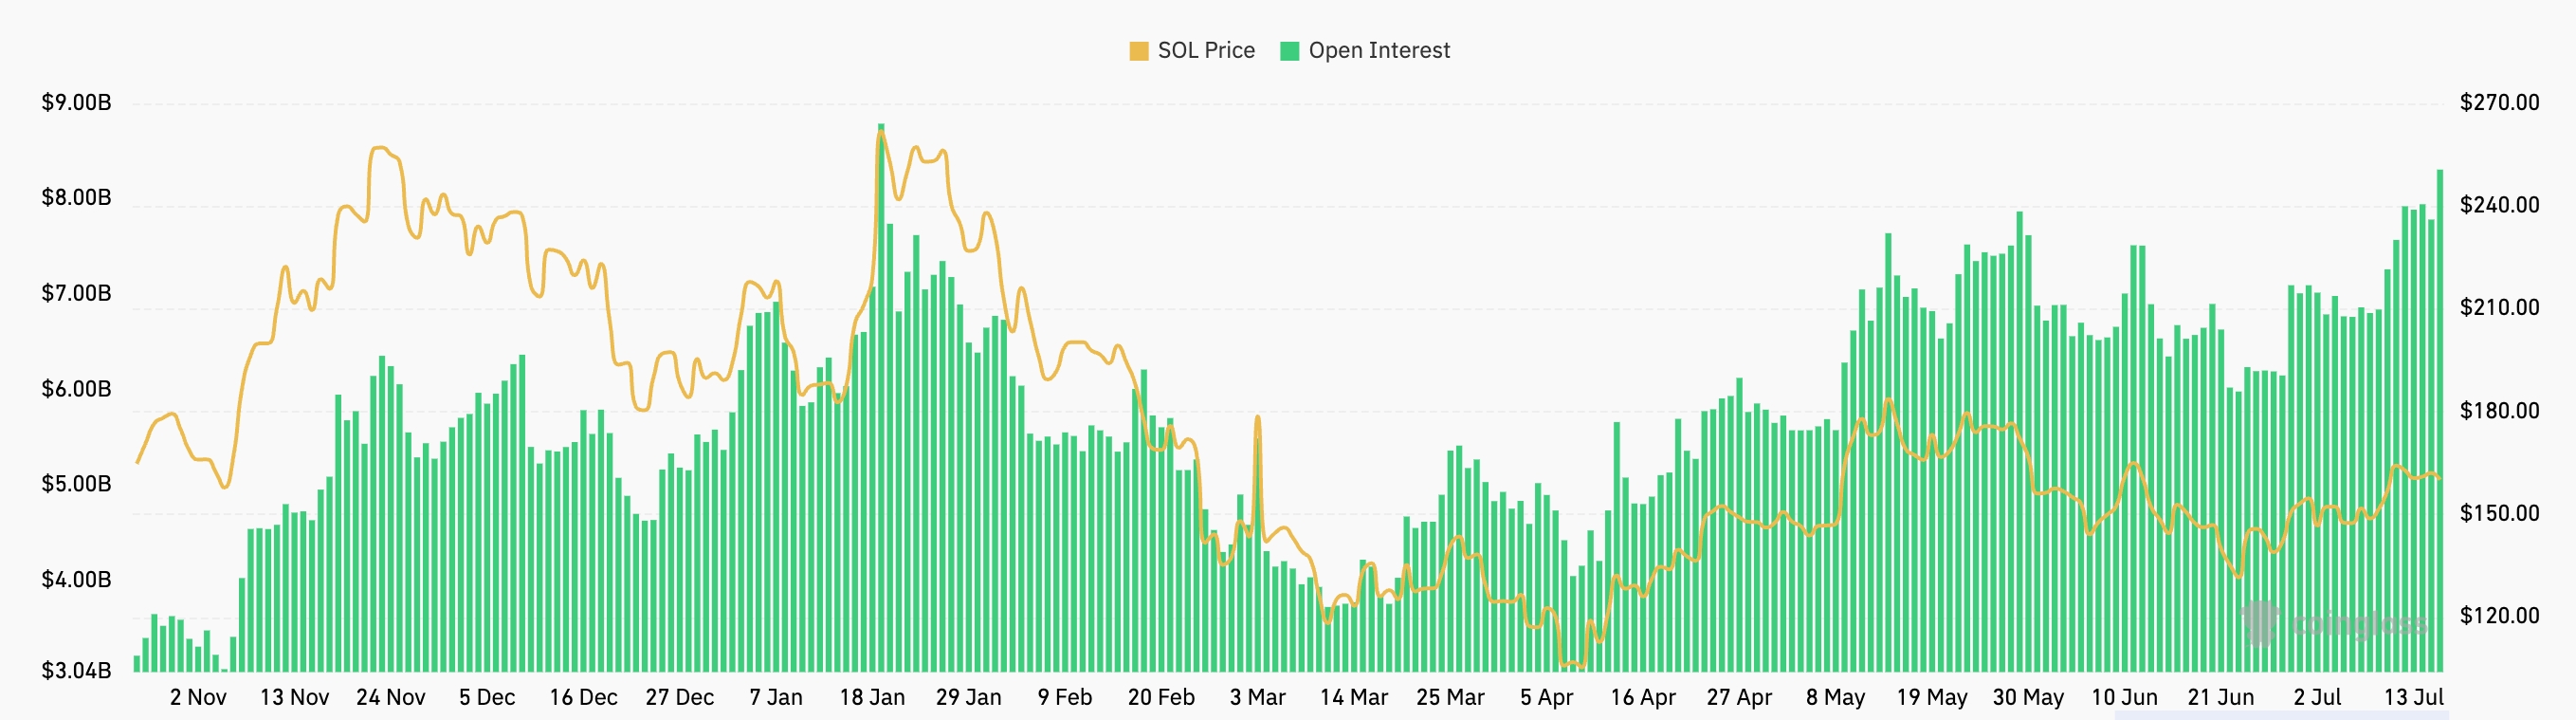 Slana open interest | Source: CoinGlass
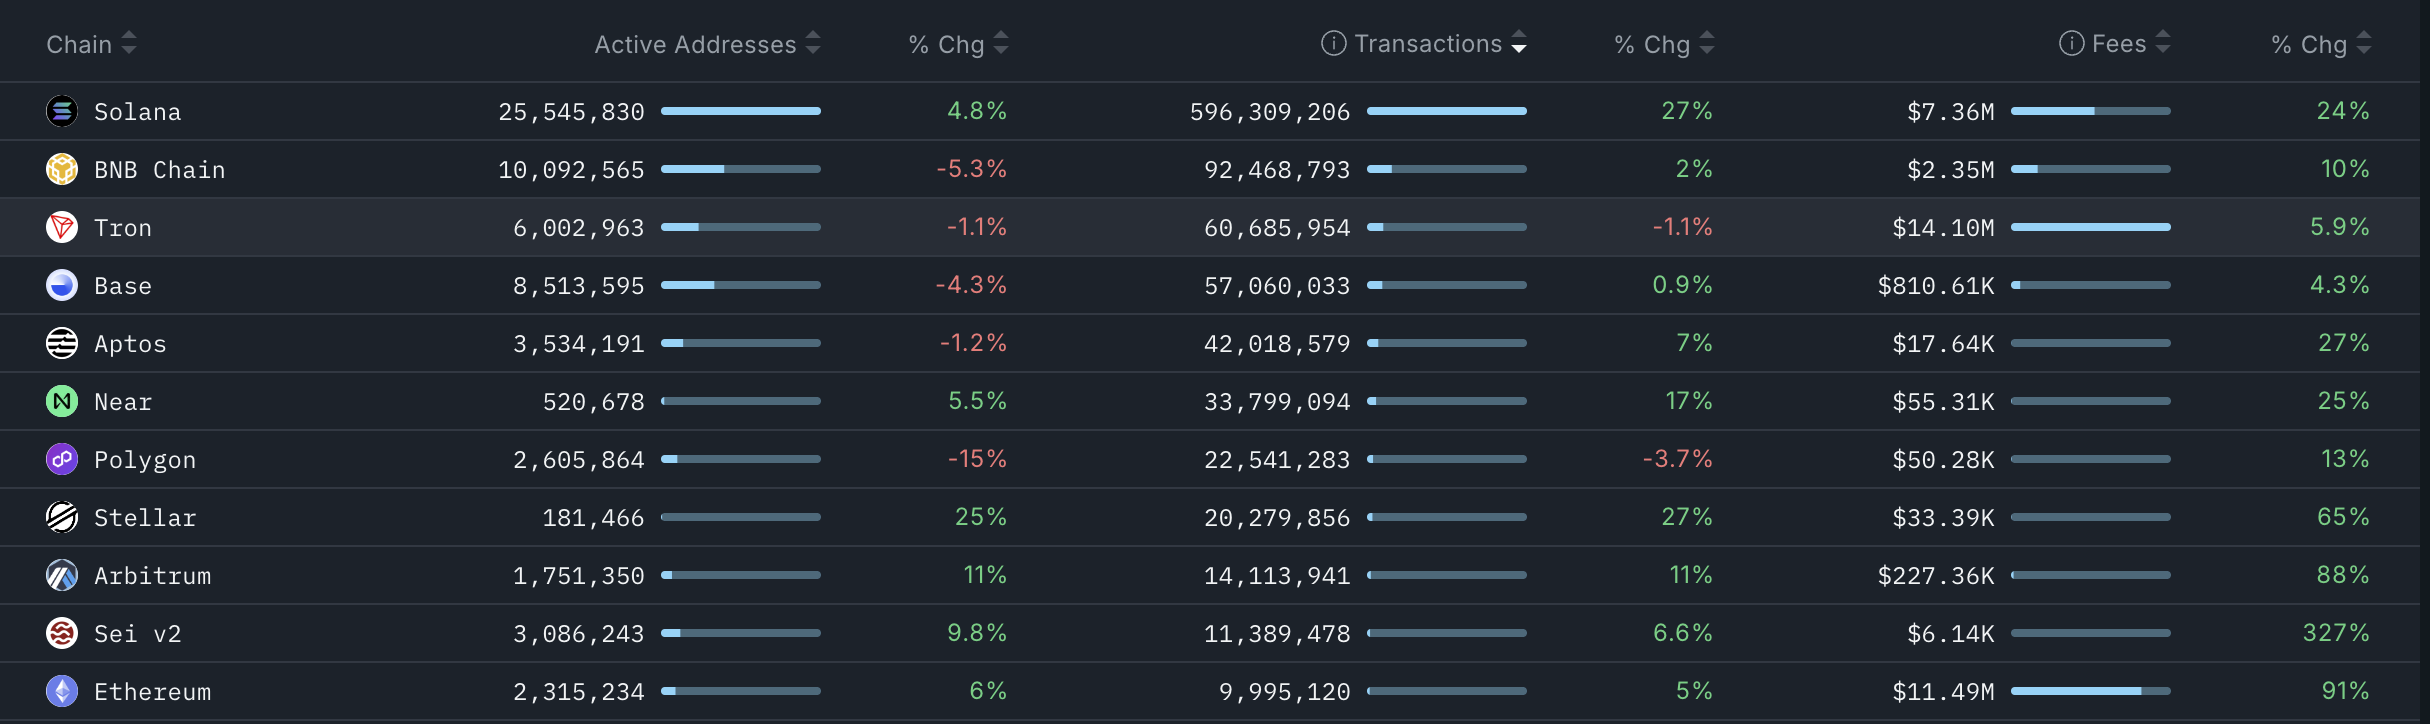
Additional metrics show continued strength in Solana’s network fundamentals. Data from Nansen reveals that transaction volume increased by 27% over the past seven days, exceeding 596 million total transactions, more than the other top ten chains combined.
Solana’s active addresses rose by nearly 5% to 25.5 million, while total network fees climbed 24% to $7.3 million. Rising network fees, address activity, and usage generally signal growing on-chain engagement.
 Solana active addresses | Source: Nansen
Further data shows that Solana’s stablecoin network is thriving. Its stablecoin addresses have soared by 40% in the last 30 days to over 3.3 million, while its monthly transactions and adjusted volume rose to $194.3 million and $108 billion, respectively.
Solana is also seeing more demand as the REX-Osprey SOL + Staking ETF inflows have soared to over $77 million, a significant increase for a fund that was launched less than two weeks ago.
Further, investors are still increasing their staked Solana positions. Its inflows in the last 30 days stood at 6 million tokens worth $913 million.
Solana price prediction
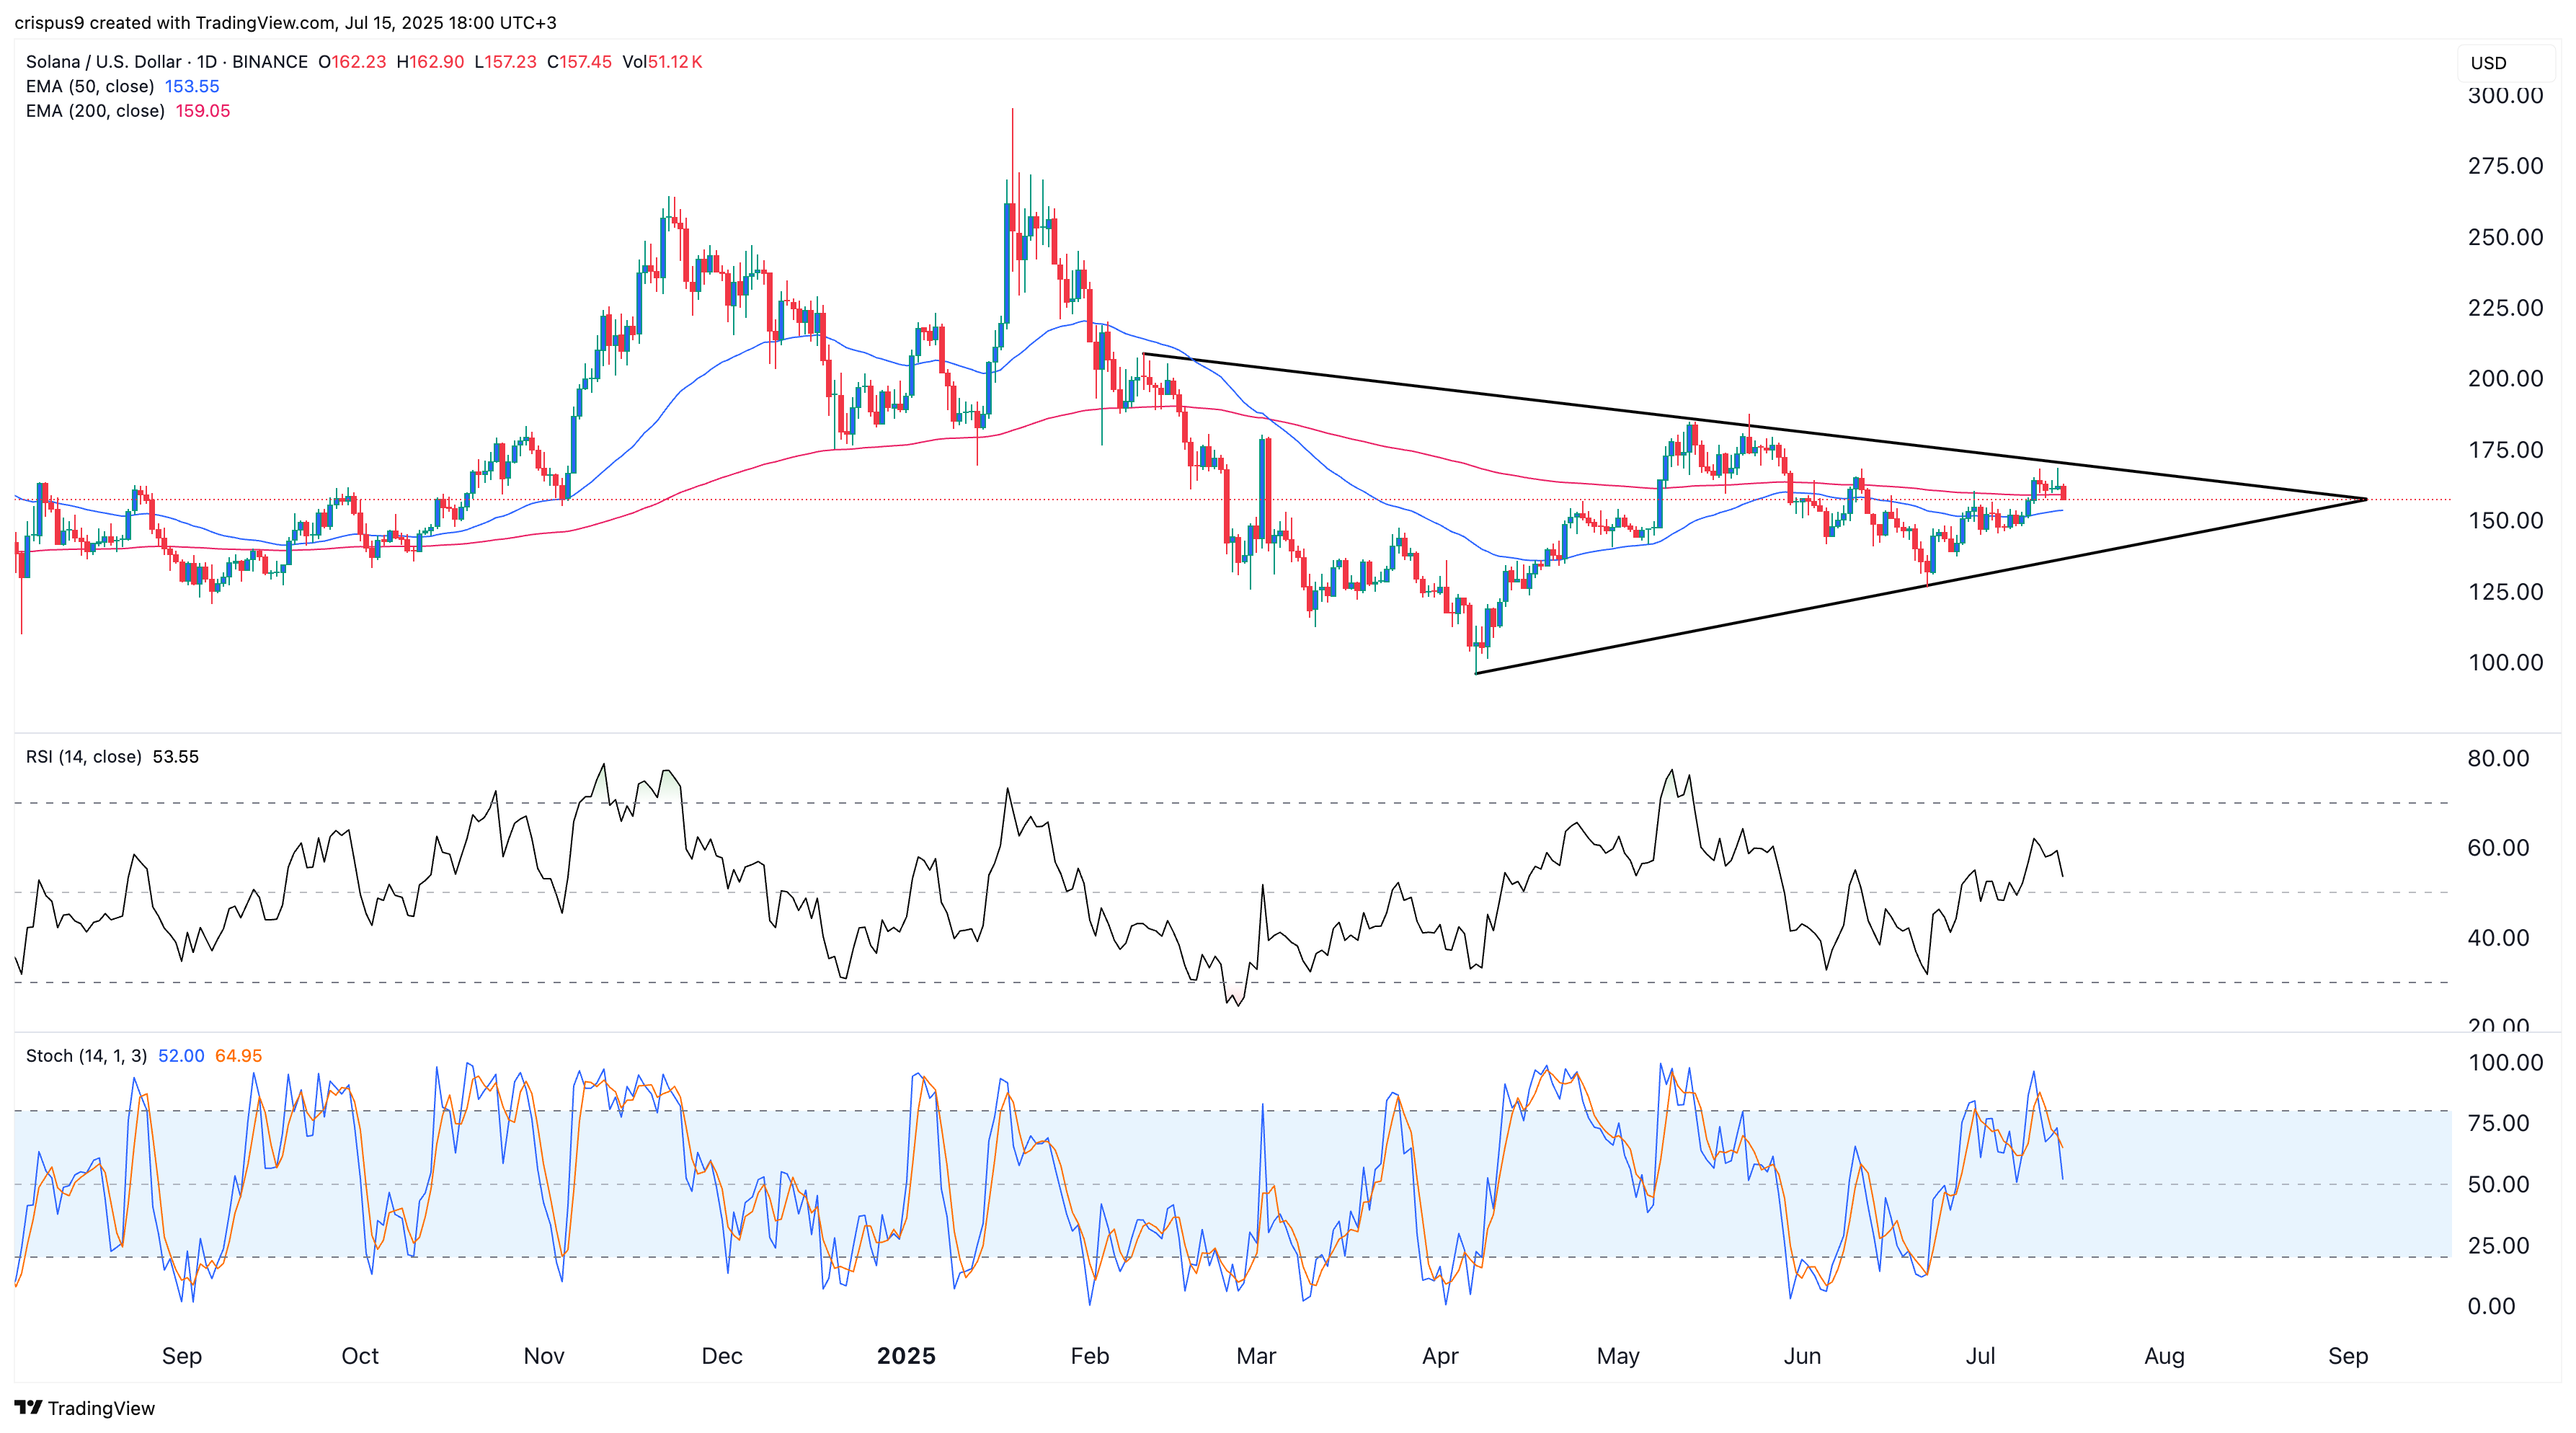 SOL price chart | Source: crypto.news
On the daily chart, SOL has traded sideways in recent days as bullish momentum slowed. Price action has formed a large symmetrical triangle, with the upper and lower trendlines converging.
SOL is consolidating near its 50-day and 200-day Exponential Moving Averages. Meanwhile, the Relative Strength Index and Stochastic Oscillator are both trending lower, reflecting reduced short-term momentum.
Still, the symmetrical triangle pattern suggests that consolidation may lead to a breakout. A move above the triangle’s upper boundary would likely confirm a bullish continuation, with $200 as the next technical target.


 English (US) ·