Solana price has rebounded from a three-year low after a wave of liquidations eased and buyers stepped back into the market, though traders remain divided on whether the token can reclaim its May highs.
Summary
- Solana price rebounded above $66 on June 8 after plunging to a three-year low near $60 amid last week’s market selloff.
- Spot Solana ETFs posted their first net outflows since May as investors reduced crypto exposure.
- Analysts are watching the $75–$81 zone as the next major hurdle for a recovery toward May highs.
According to data from crypto.news, Solana (SOL) price traded near $66 on Monday, June 8, after briefly falling below $61 during last week’s market-wide selloff. The token’s rebound followed six consecutive days of losses that pushed the token down more than 20% from levels seen at the start of June.
The recovery arrived as selling pressure began to exhaust itself after one of the sharpest declines Solana has experienced this year. Extreme fear across crypto markets triggered heavy liquidations, while several large holders reduced exposure during the downturn.
As volatility cooled over the weekend, dip buyers returned and helped establish a short-term trading range between roughly $60 and $68.
Fresh institutional data has added another challenge for bulls. SoSoValue data shows Spot Solana ETFs recorded net outflows in the past two trading days, ending a stretch of positive flows that had remained intact since May. The reversal came as investors reassessed risk exposure following stronger-than-expected U.S. economic data and renewed pressure across digital assets.
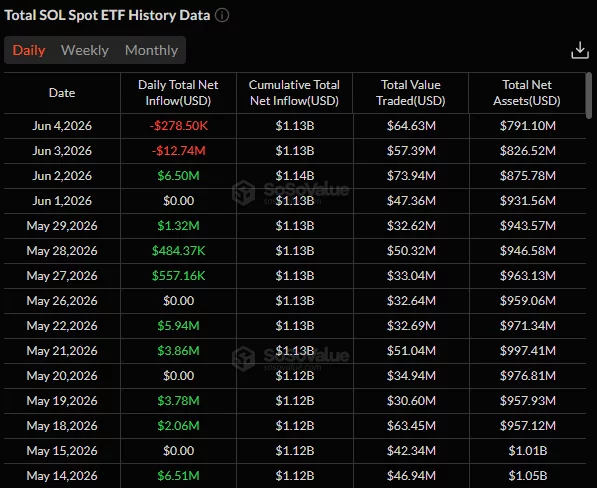 Source: SoSoValue
A stronger macro backdrop for the U.S. dollar also weighed on sentiment. June 5 non-farm payrolls data exceeded expectations, prompting traders to reduce expectations for Federal Reserve rate cuts later this year. Treasury yields climbed while risk assets sold off, contributing to sharp declines across both Bitcoin and major altcoins.
On-chain activity, meanwhile, showed continued distribution from larger market participants. Several whale wallets and institutional entities moved substantial amounts of SOL toward exchanges during the selloff, increasing available supply at a time when market demand was already weakening.
Technical structure leaves room for a larger recovery
The daily chart shows SOL rebounding directly from the 0 Fibonacci retracement level near $60.3, a zone that also coincides with the asset’s lowest price since early 2023. Buyers defended that support aggressively, allowing SOL price to recover back above $66.
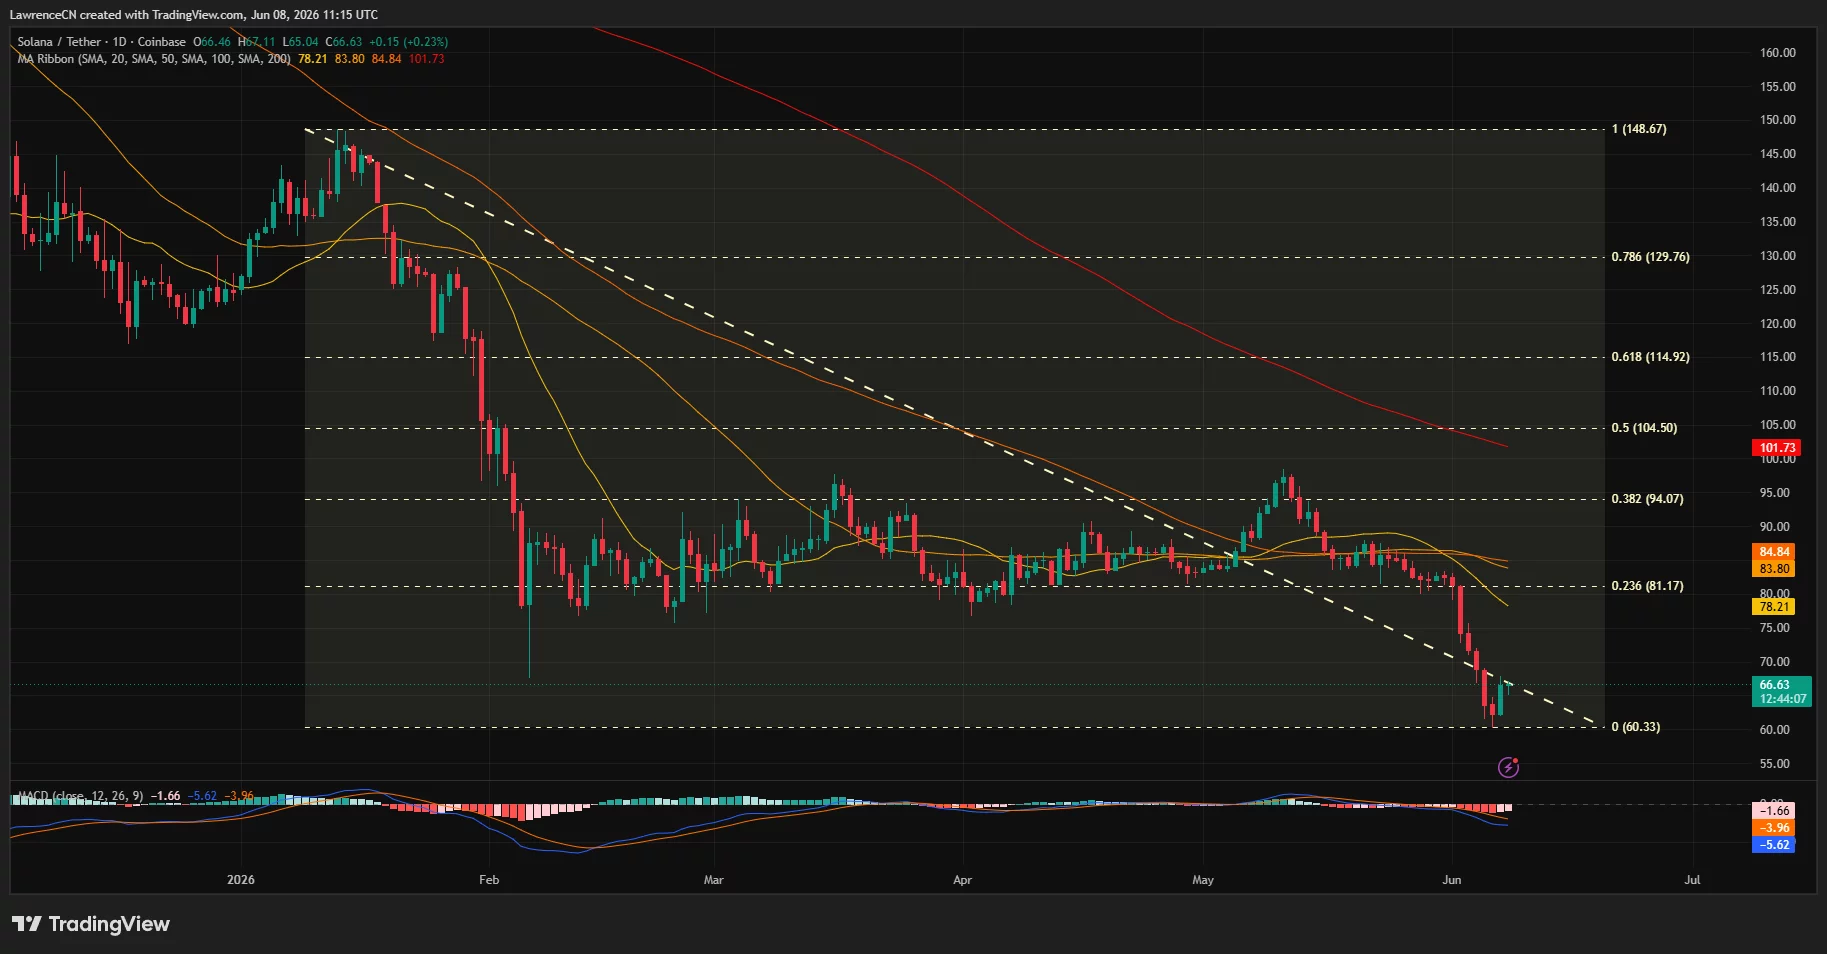 Solana price has fallen below all key moving averages on the daily chart — June 8 | Source: crypto.news
Several key resistance levels remain overhead. The first major barrier sits near $81, which aligns with the 0.236 Fibonacci retracement level. Above that, traders are watching the $94, $104 and $115 zones, corresponding to higher Fibonacci retracement levels from the broader decline that began after January’s peak near $149.
Moving averages continue to favor sellers for now. Solana remains below its 20-day, 50-day, 100-day and 200-day simple moving averages, which cluster between roughly $78 and $102. The daily MACD also remains below its signal line despite showing early signs of stabilization after the recent collapse.
Commenting on the current Solana market, crypto analyst Daan Crypto Trades noted that SOL has already delivered the type of move typically seen after a lengthy period of consolidation.
“$SOL Did indeed get that 20-30% move upon breaking the range. That’s what happens after 3+ months of compressed price action…The moment a break occurs after such a long consolidation period, the result is usually pretty large and gives you time to hop on the move.”
Daan added that bulls now need to reclaim lost territory after the breakdown from a multi-month trading range, noting that Solana is now retesting a major weekly support area that could determine whether the recent decline develops into a deeper downtrend or the start of a recovery.
Derivatives data highlights where traders are concentrating risk. CoinGlass liquidation heatmaps show a large cluster of leveraged positions sitting between $75 and $77, with another significant concentration above $80. A move into those regions could trigger short liquidations and accelerate upside momentum if buyers regain control.
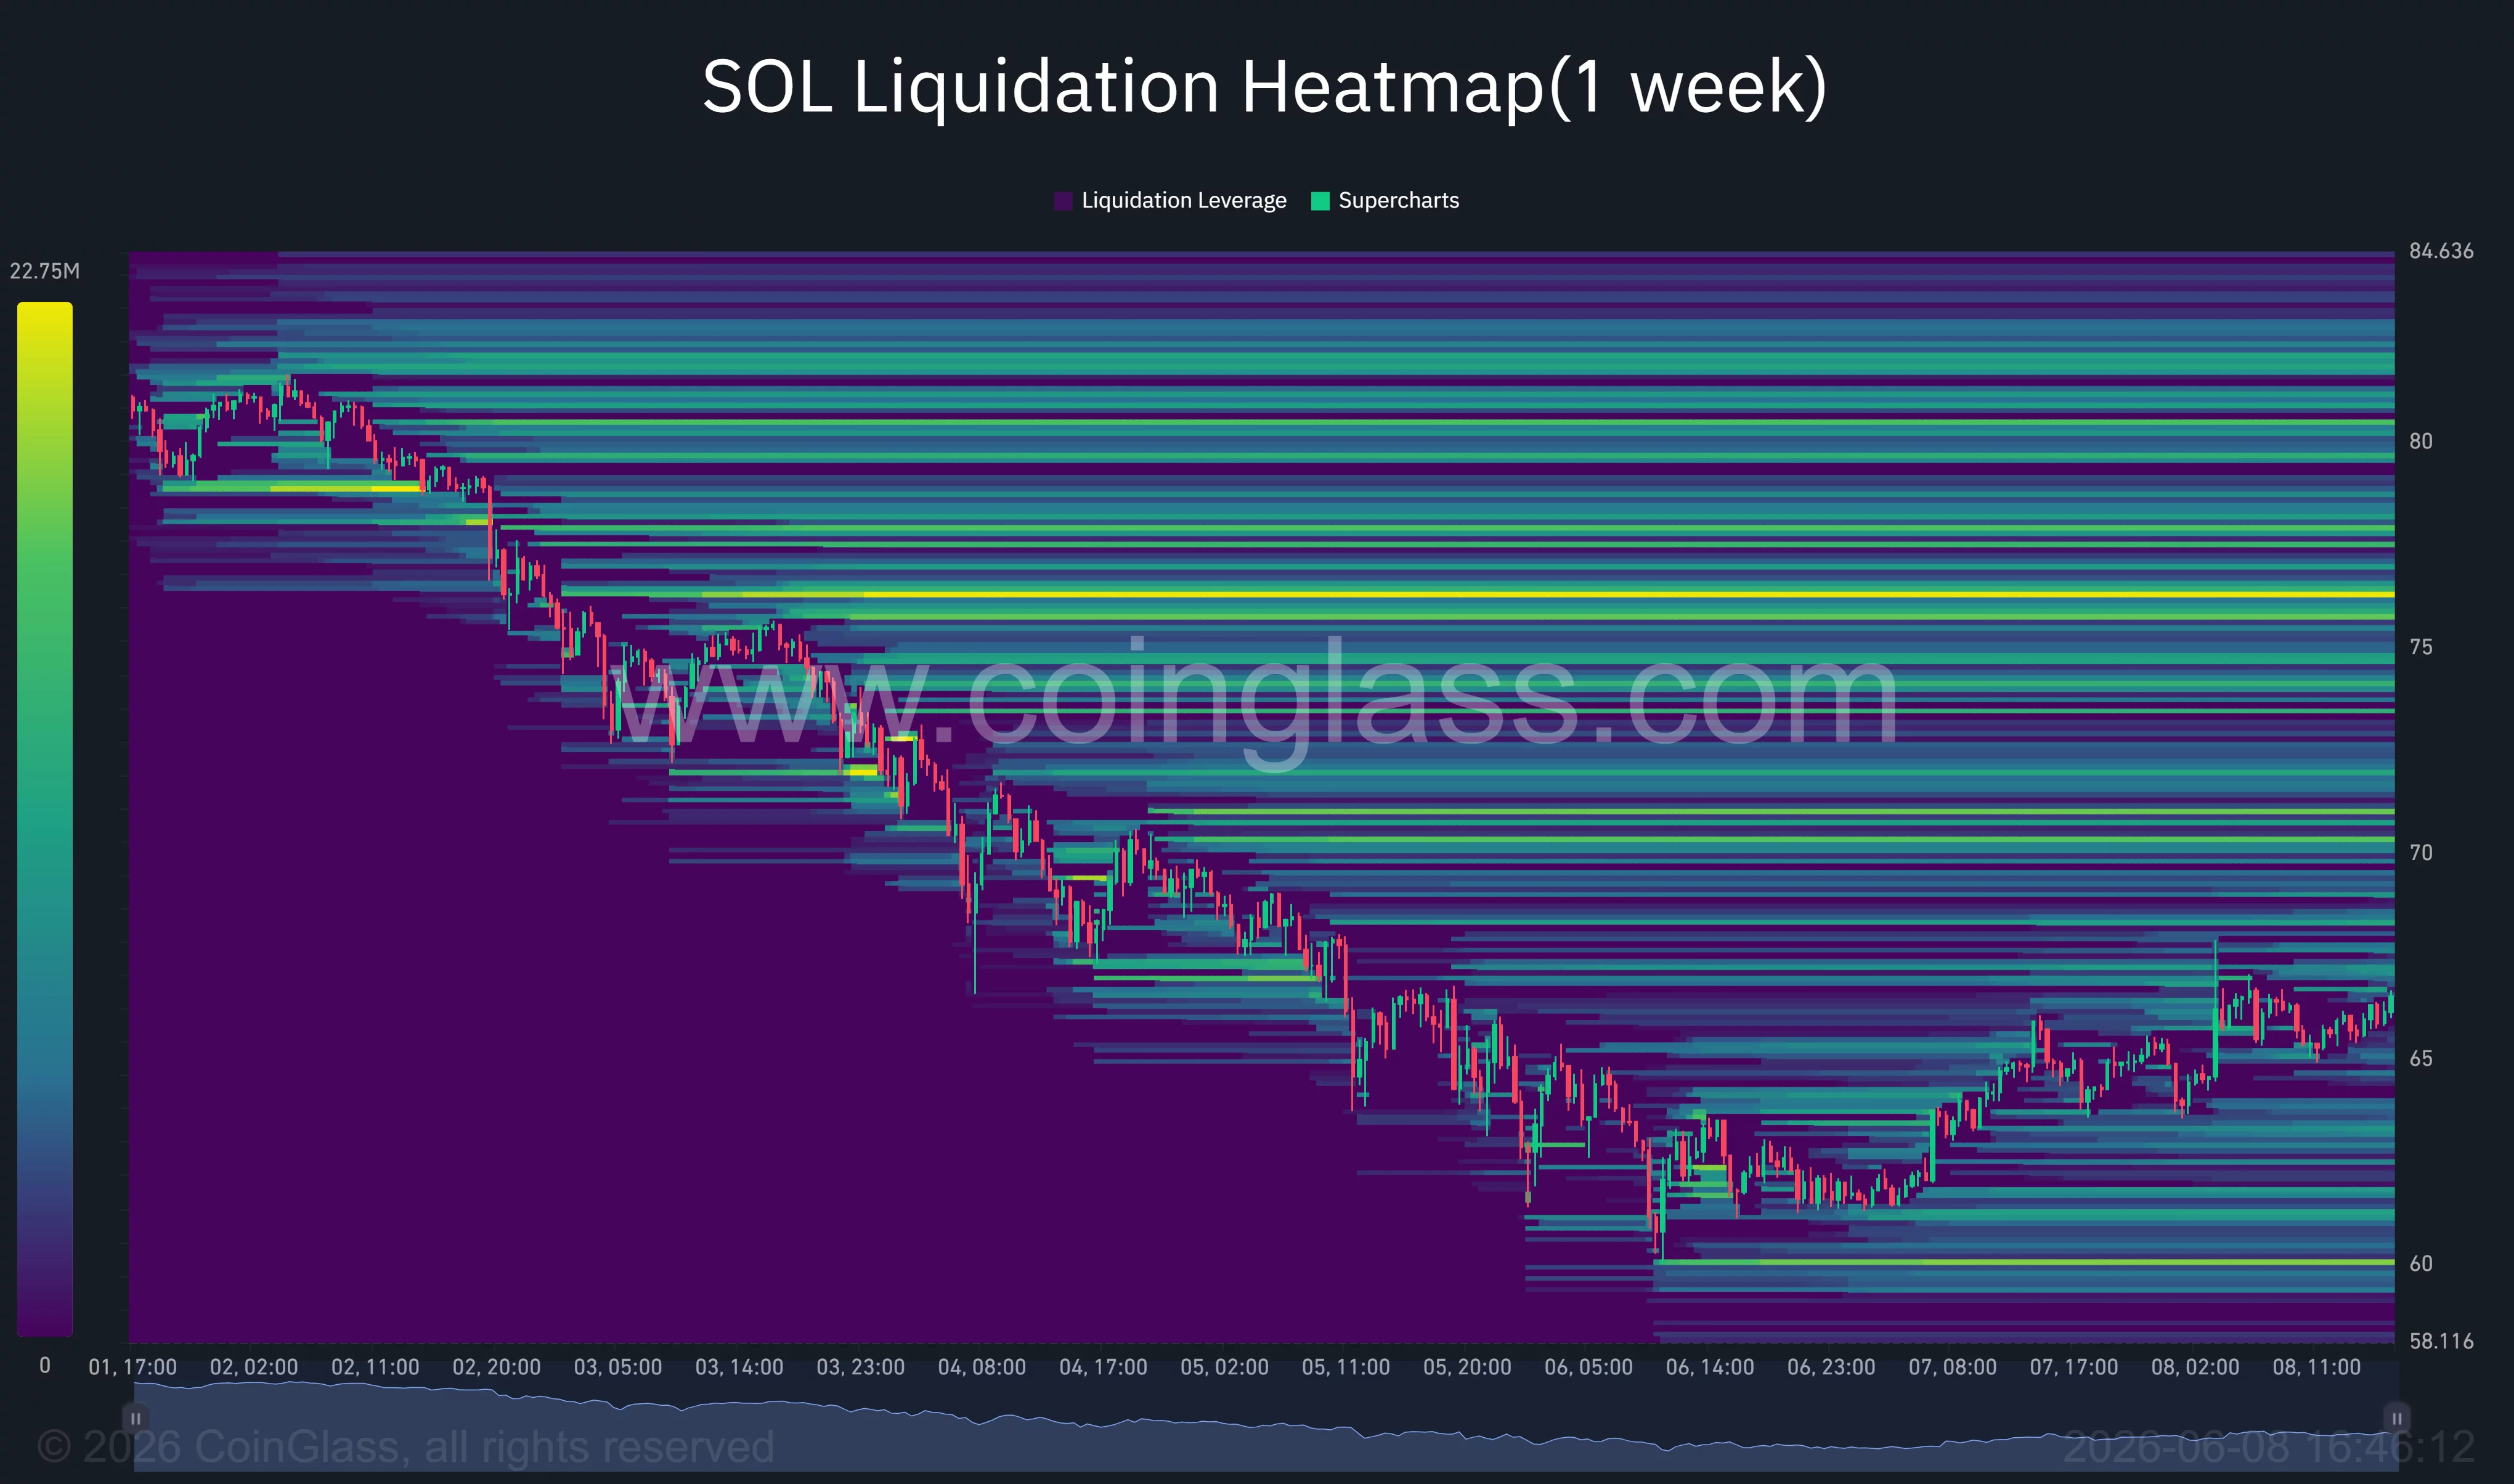 Solana liquidation heatmap | Source: CoinGlass
Downside risks remain despite the rebound
Several risks could still invalidate the recovery thesis. Failure to hold the $60 support zone would expose Solana to another leg lower and potentially trigger fresh liquidations across leveraged futures markets.
Macro conditions also remain uncertain. Additional strength in the U.S. dollar, rising Treasury yields, or another hawkish shift in Federal Reserve expectations could pressure crypto assets again. Geopolitical tensions and continued institutional de-risking across digital assets would likely produce similar effects.
Bitcoin’s direction remains another critical factor. Solana’s recent decline coincided with heavy ETF outflows and weakness in the broader crypto market. Unless Bitcoin establishes a more durable recovery, reclaiming May’s highs near $95 for Solana may prove difficult despite the recent bounce.
For now, the rebound from three-year lows has provided traders with a reason to watch for a larger recovery, but bulls must first reclaim the $75 to $81 resistance zone before the path toward May’s highs becomes realistic.
Disclosure: This article does not represent investment advice. The content and materials featured on this page are for educational purposes only.


 English (US) ·