 6 hours ago
2
6 hours ago
2
Key Notes
- Bitget and Coinglass data show $79.8M in long exposure and a dense liquidation zone below $0.40.
- RSI divergence and key Fibonacci support at $0.44 signal weakening momentum.
- An XLM price close below $0.44 may set the stage for a decline toward $0.33 for the Stellar crypto.
Following a sharp rejection at $0.50, Stellar’s native cryptocurrency XLM XLM $0.43 24h volatility: 6.3% Market cap: $13.52 B Vol. 24h: $780.61 M , is heading south, correcting 5% today and moving to $0.43 as of press time.
Following an 80% rally over the past month, XLM is losing steam as bearish pressure builds and a potential 30% correction looms. Investors are now closely watching Stellar’s next move.
Xlm price holds above $0.45, but liquidation risk mounts
Stellar’s XLM is currently trading just above $0.45, but data from Bitget’s 30-day XLM/USDT liquidation map reveals elevated risk of downside volatility.
The map shows approximately $79.8 million in long positions compared to $42.1 million in shorts. However, there’s a large cluster of long liquidations concentrated below the $0.40 mark, as per Coinglass data.
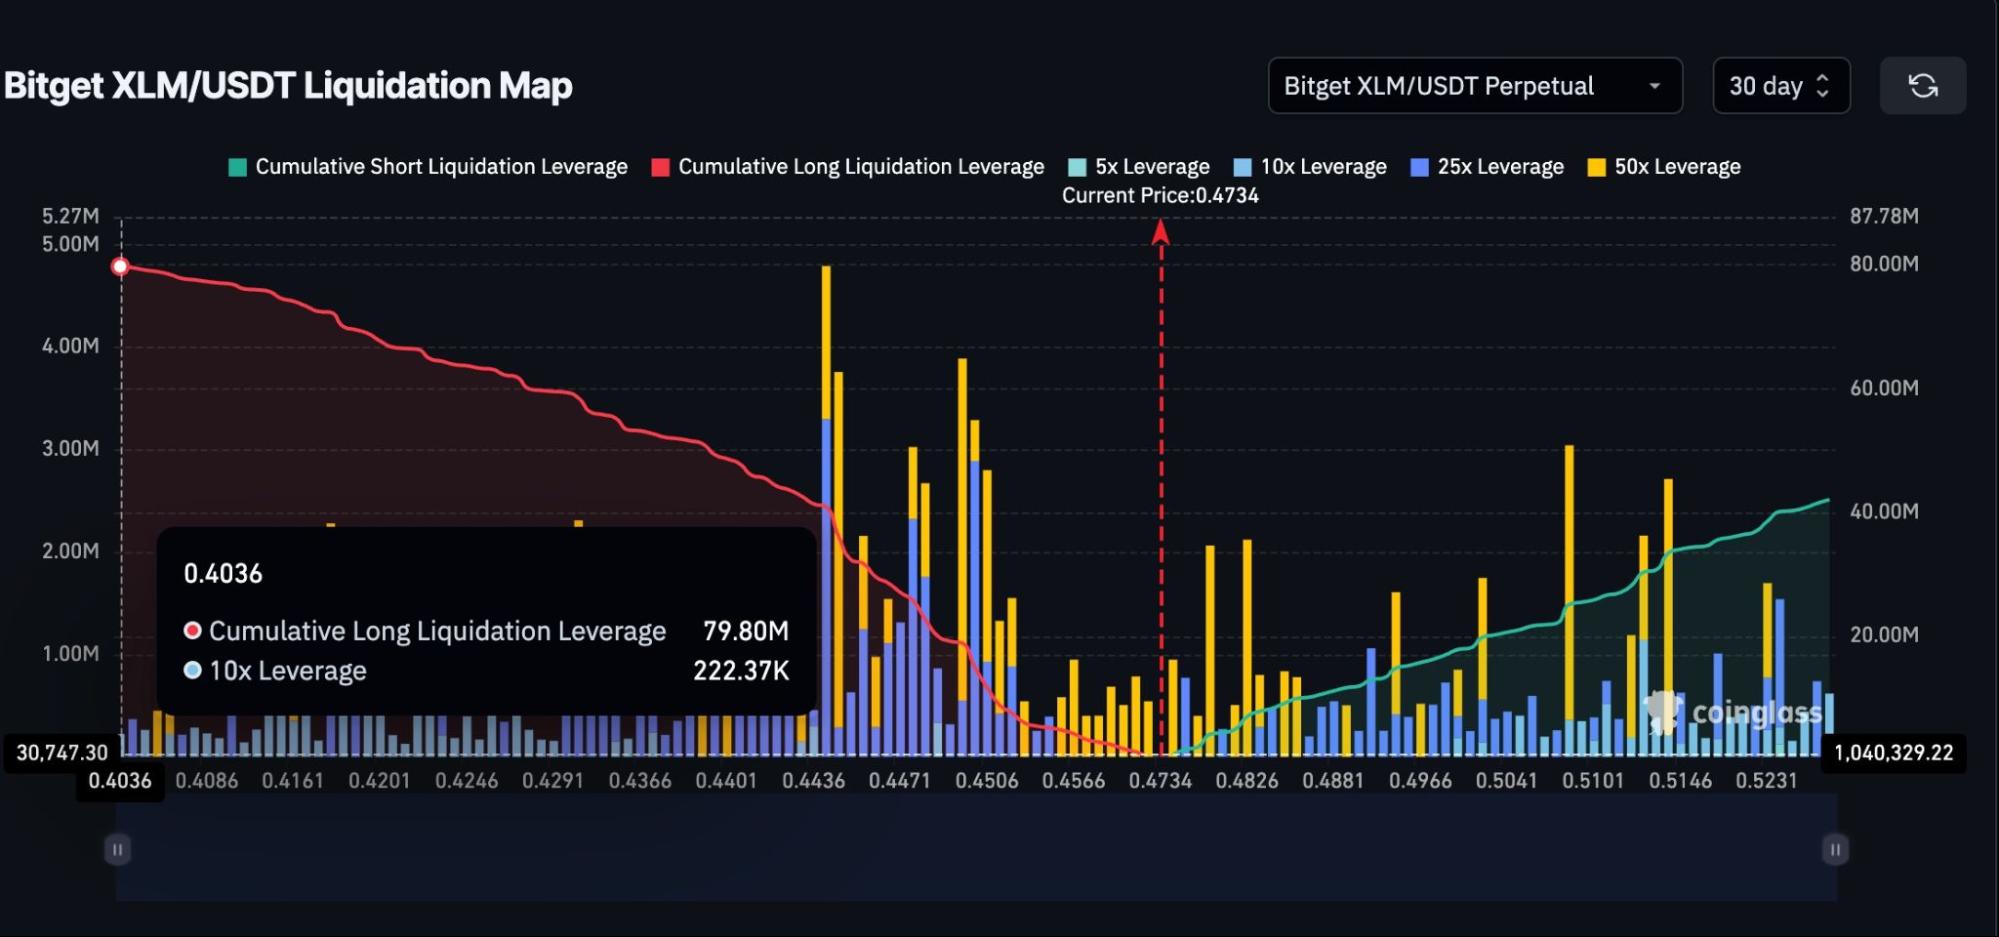
XLM Liquidation Cluster – Source: Coinglass
An XLM price break below this level could trigger cascading forced liquidations.
According to the data, successive declines would first hit smaller pockets of long exposure, but a move beneath $0.40 could intensify selling as the dense liquidation zone amplifies pressure on the order book.
The Relative Strength Index (RSI) for Stellar has been forming lower highs on the daily chart, signaling weakening momentum. This pattern mirrors the December correction, when XLM dropped over 40%.
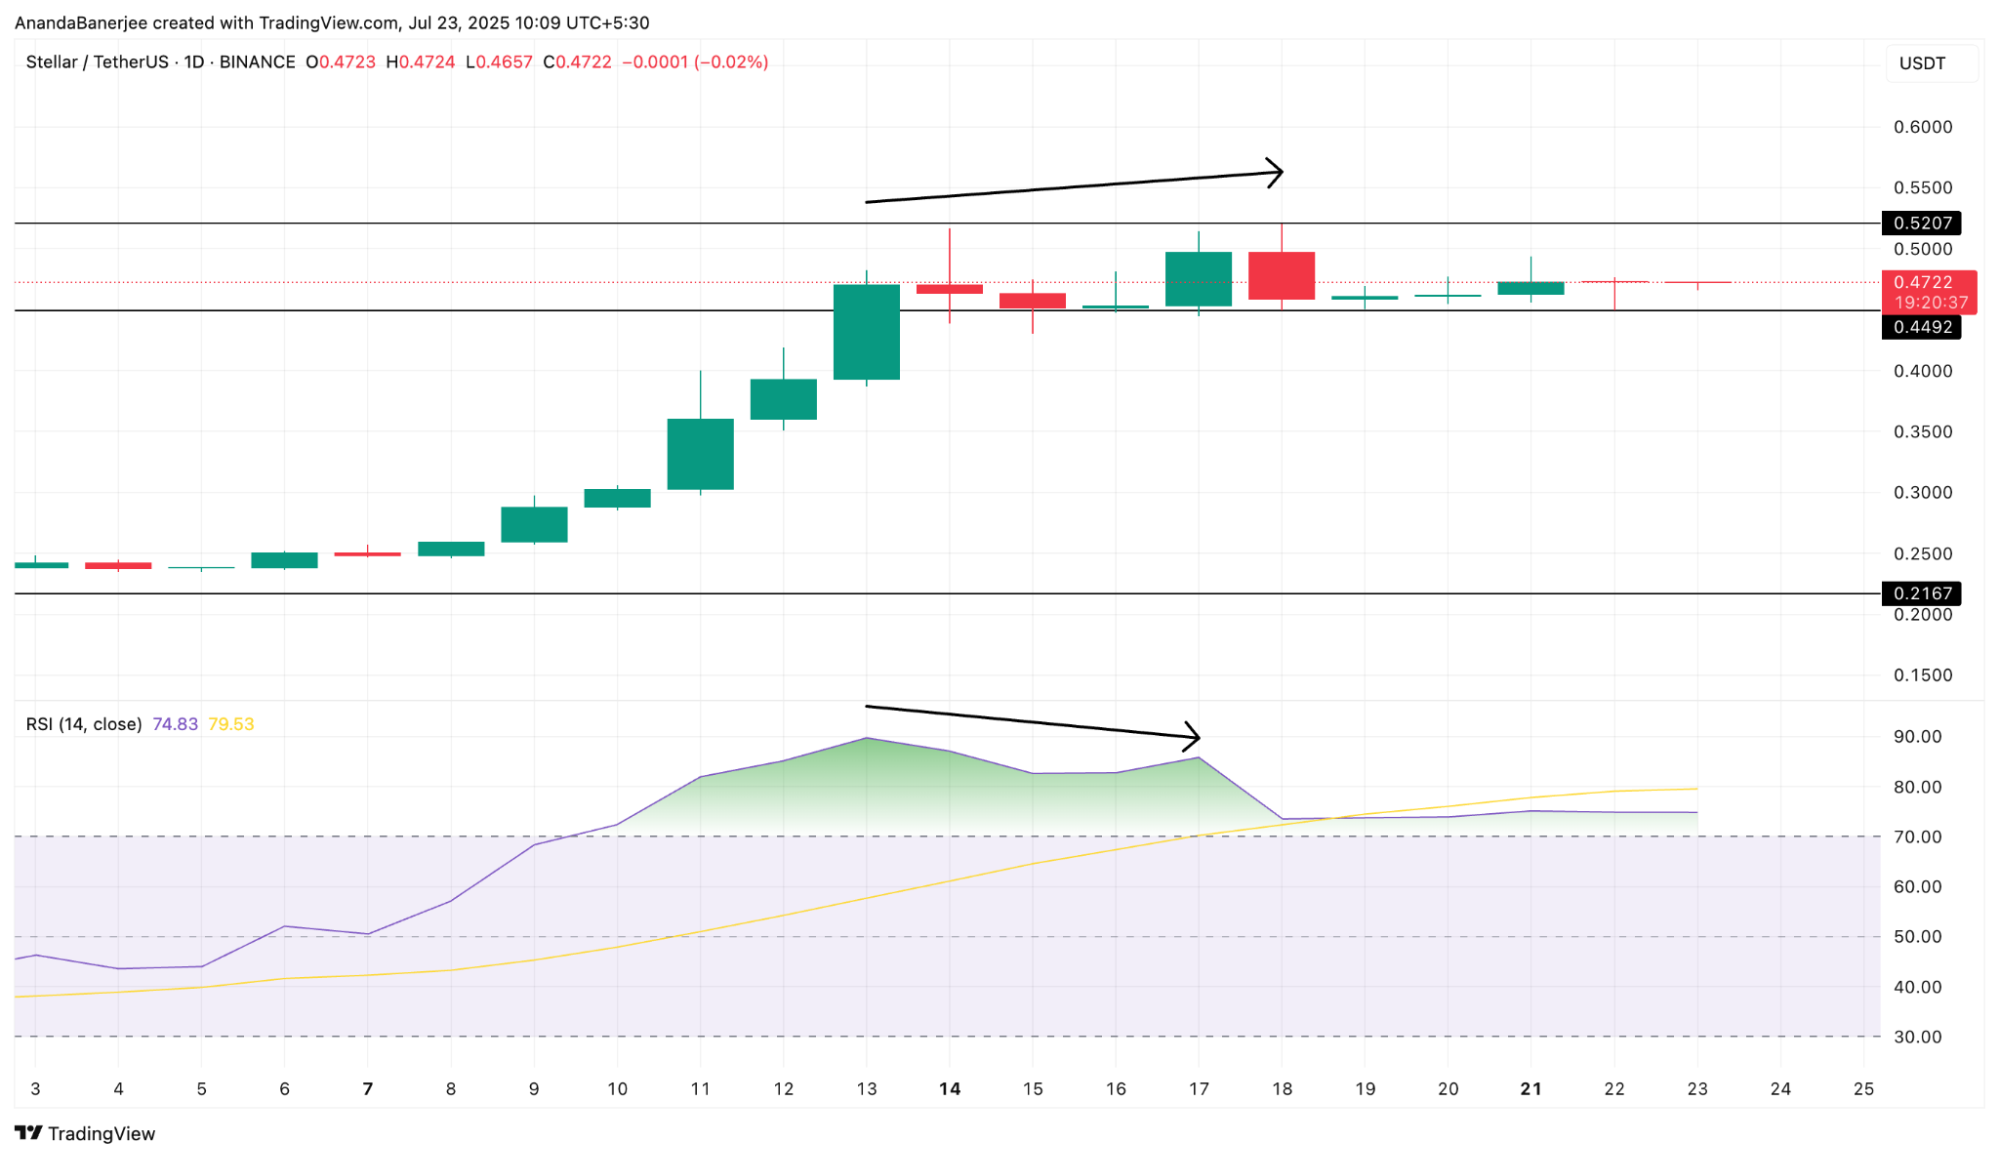
XLM RSI Divergence: TradingView
The RSI, which gauges the strength of recent price action on the scale of 0-100, can signal weakening momentum when it declines despite steady or rising prices. This divergence often indicates an increased risk of a price pullback.
The Fibonacci retracement drawn from the $0.21 low to the $0.52 high for XLM outlines potential support zones in the event of a sell-off, with the 0.236 level at $0.44 emerging as a key area due to multiple prior support interactions.
XLM is currently holding above $0.44, but a daily close below this level would shift attention to the $0.40 mark.
A drop below $0.40 would validate the liquidation risk scenario, potentially accelerating the fall toward $0.33. A 40% decline from the recent $0.52 high, mirroring the December 2024 pattern, also projects downside below $0.33.
Disclaimer: Coinspeaker is committed to providing unbiased and transparent reporting. This article aims to deliver accurate and timely information but should not be taken as financial or investment advice. Since market conditions can change rapidly, we encourage you to verify information on your own and consult with a professional before making any decisions based on this content.

Bhushan is a FinTech enthusiast and holds a good flair in understanding financial markets. His interest in economics and finance draw his attention towards the new emerging Blockchain Technology and Cryptocurrency markets. He is continuously in a learning process and keeps himself motivated by sharing his acquired knowledge. In free time he reads thriller fictions novels and sometimes explore his culinary skills.


 English (US) ·