Sui price is holding the $0.93 support zone as two new U.S. spot staking exchange-traded funds begin trading.
Summary
- SUI trades near support after a prolonged downtrend.
- Two U.S. spot staking ETFs now offer direct exposure with on-chain yield.
- $1.20 remains the key breakout level to confirm a trend shift.
Sui was trading at $0.9364 at press time, down 3.3% in the last 24 hours. Over the past week, the price moved between $0.8991 and $1.04. Buyers have stepped in several times near the $0.90 area.
The wider trend is still weak. Sui (SUI) is down 40% in the last 30 days and about 70% over the past year. Each recovery attempt has stalled below prior highs.
Derivatives show mixed positioning. According to CoinGlass data, futures volume rose 5% to $616.58 million, while open interest fell 2.93% to $493 million. When volume increases but open interest drops, it often points to short-term trades being opened and closed rather than strong conviction in one direction.
First U.S. spot SUI ETFs begin trading
Two spot ETFs tied directly to SUI began trading on Feb. 18.
The Canary Staked SUI ETF (SUIS) from Canary Capital Group began trading on Nasdaq. The fund holds spot SUI and stakes part or all of its holdings on the network. Staking rewards are reflected directly in the ETF’s net asset value.
On the same day, Grayscale Investments launched the Grayscale Sui Staking ETF (GSUI) on NYSE Arca. The fund carries a 0.35% annual sponsor fee, waived for the first three months or until assets reach $1 billion. At launch, 100% of holdings were staked.
Both products are structured as spot ETFs, not futures-based funds. They hold actual SUI tokens and pass staking rewards through to investors via net asset value. With Sui’s staking yield near 7%, the structure offers exposure to both price movement and on-chain yield.
ETF launches for Bitcoin in 2024 and Ethereum in 2025 attracted significant inflows. It is unclear if SUI will experience a comparable level of demand. Further token purchases by the funds could support the price. If participation disappoints, the impact may be limited.
Sui price technical analysis
On the daily chart, $0.93–$0.90 has acted as key support. The price has repeatedly tested this area, with buyers intervening to stabilize price. Short-term downward pressure might lessen if $0.90 holds.
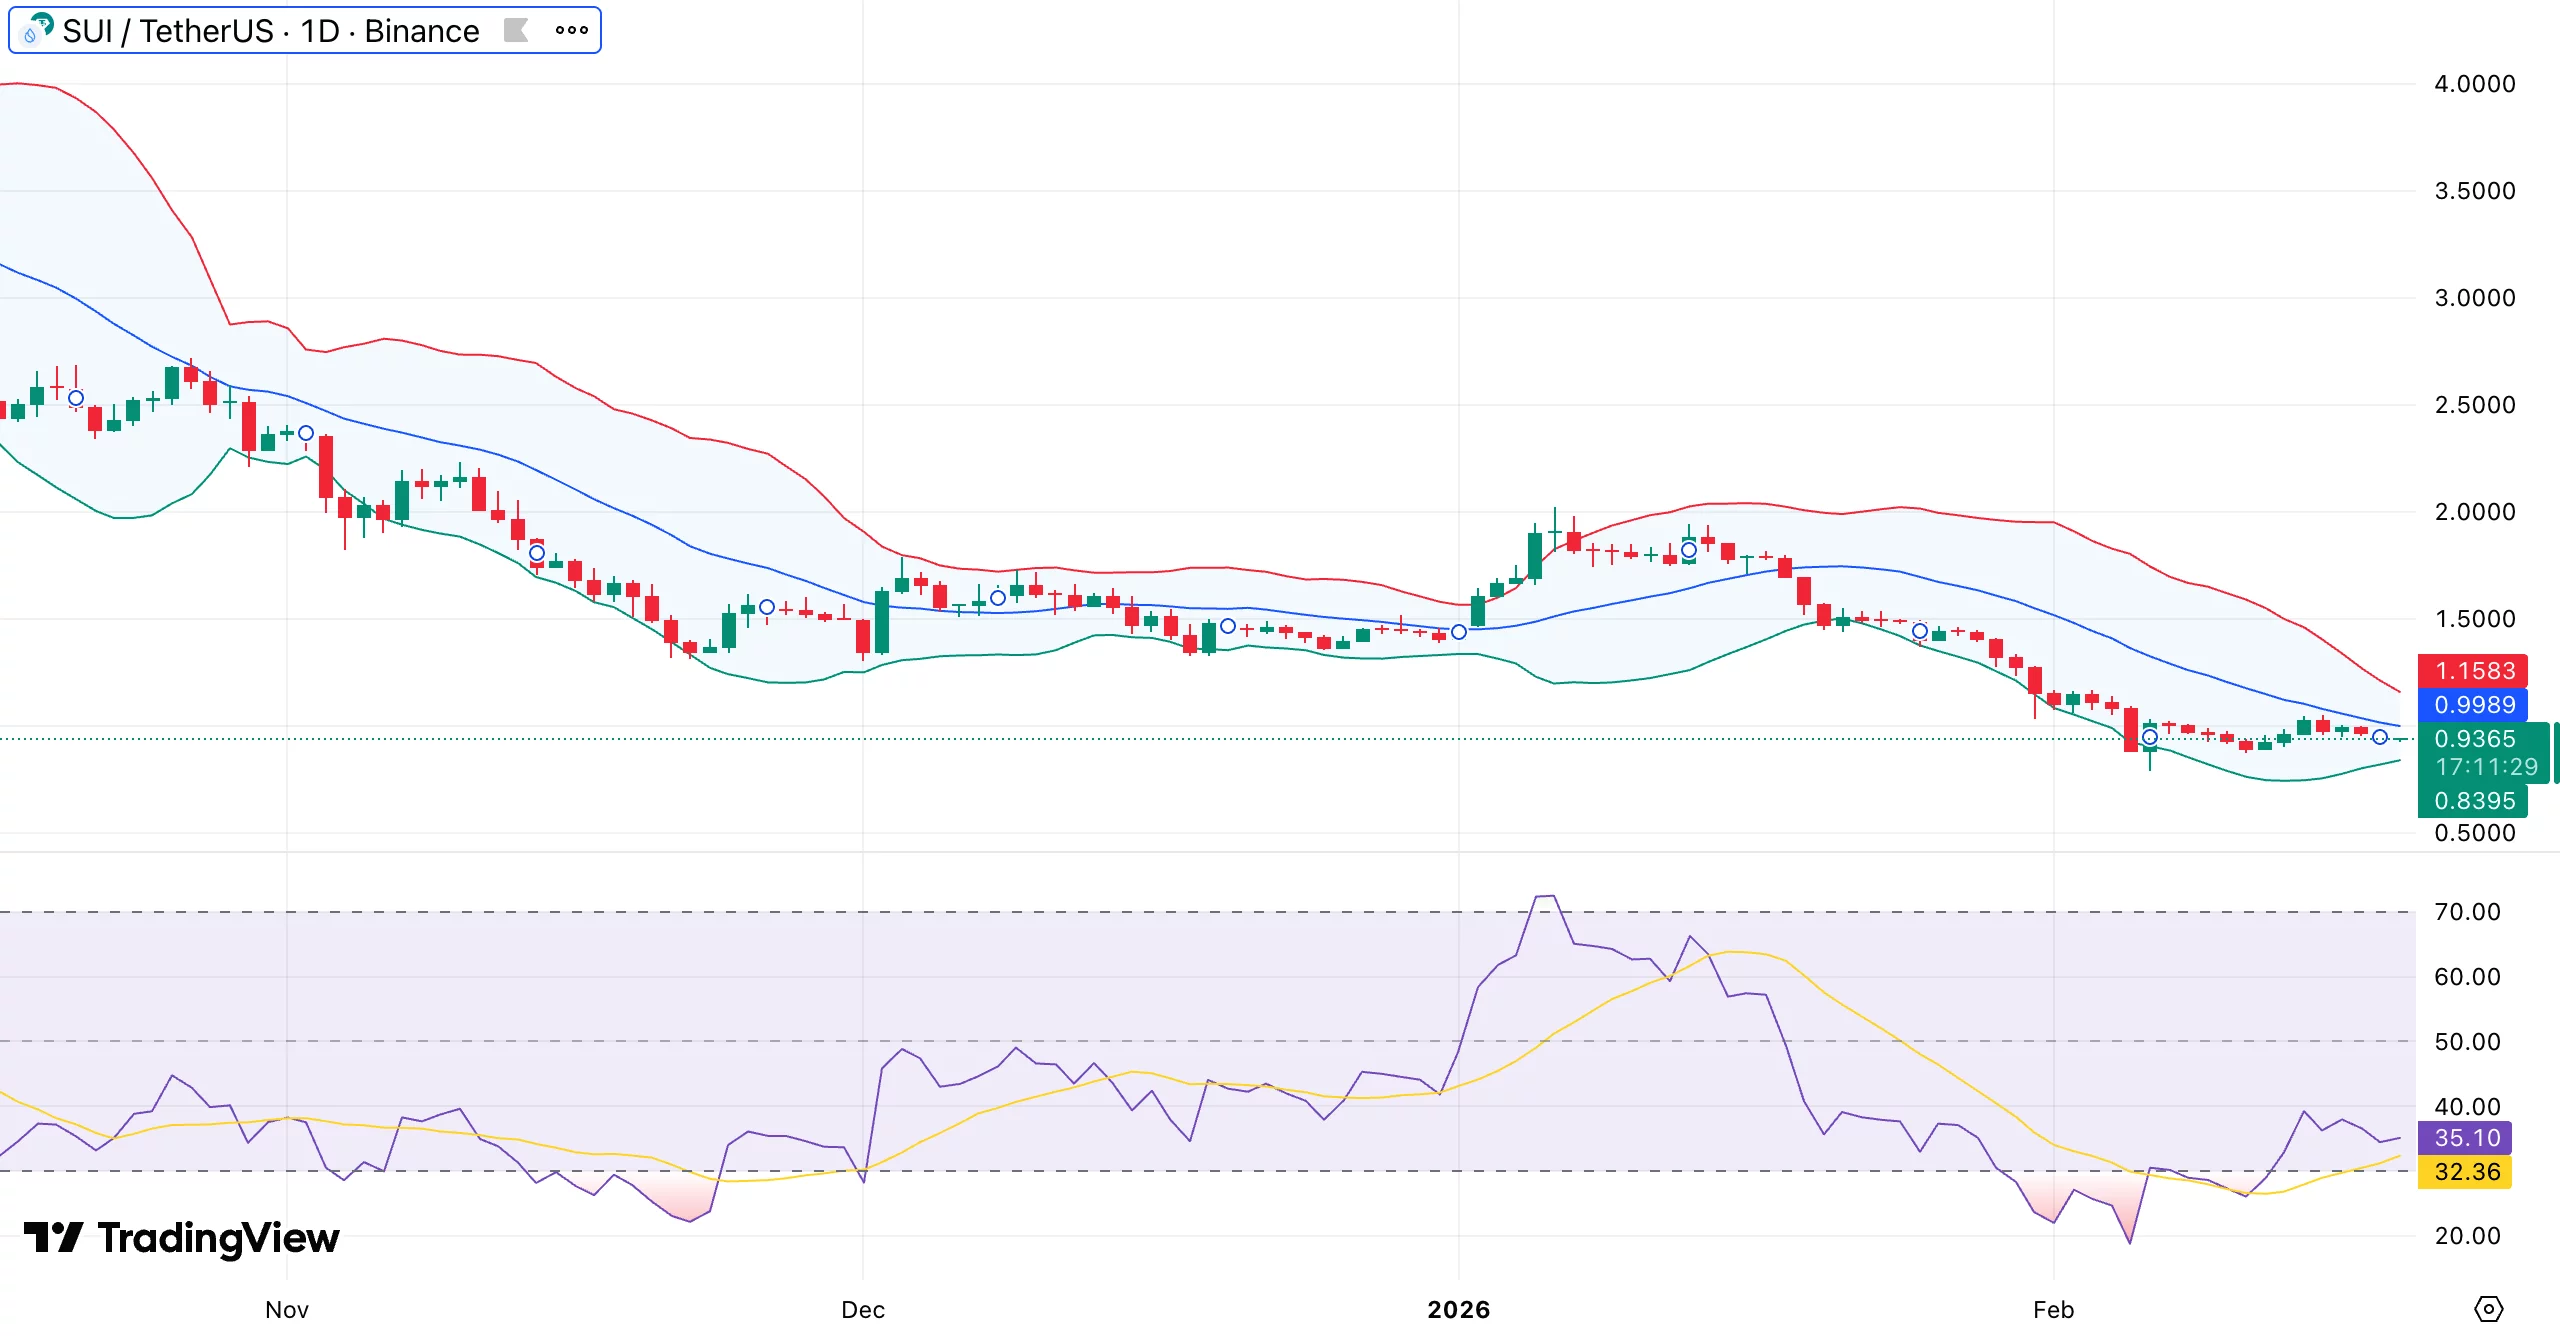 Sui daily chart. Credit: crypto.news
The tightening of the Bollinger Bands indicates compression of volatility. Larger moves are often preceded by such squeezes. Whether or not resistance is recovered will determine the course.
The relative strength index is currently in the mid-30s after recovering from oversold levels close to 25. A mild bullish divergence has formed, with RSI making a higher low while price retested support. Momentum is improving, though it has not yet turned bullish.
SUI still trades below the 20-day moving average. Lower highs remain intact since the rejection near $2.00. The first sign of structural improvement would be a break above $1.05–$1.10.
The major breakout level sits at $1.15–$1.20. This zone aligns with the prior breakdown structure and horizontal supply. A daily close above $1.20 would break the lower-high pattern and could open room toward $1.45–$1.60.
If $0.93 fails, the next supports lie near $0.85 and $0.75. For now, SUI is compressing near support while ETF catalysts enter the market. Volume expansion on a move above $1.05–$1.20 will likely decide the next trend.


 English (US) ·