TUT crypto rallied as much as 235% today after community votes secured it a listing on the Binance exchange.
According to data from crypto.news, Tutorial (TUT) rose from $0.0167 to an intraday high of $0.0564 before pulling back to $0.0396 by Friday afternoon in Asia. The rally extended its weekly gains to an impressive 2,600%, making it one of the top-performing altcoins over the period.
The surge was backed by high trading activity, with on-chain data showing a 600% increase in daily volume, which crossed $189 million. TUT’s market cap stood at $38.5 million. Interest from derivatives traders also spiked, with CoinGlass reporting a 400% jump in open interest for TUT futures, reaching $73.59 million at the time of writing.
Today’s gains were mostly fueled by community hype after TUT secured a listing on Binance. It was picked in the first round of the exchange’s “Vote to List” campaign, alongside other memecoins like Mubarak (MUBARAK), CZ’s Dog (BROCCOLI714), and Banana For Scale (BANANAS31).
According to the platform’s official announcement, the memecoins, exempt from a listing fee, can now be traded against USDT and USDC pairs, with withdrawals opening on March 28 at 21:00 UTC. A seed tag has been applied to them.
Traders are currently divided on what’s next. Some think a sell-off might be coming, which isn’t unusual after a major exchange listing, especially since the hype is often baked into the price before the listing even goes live.
As reported by crypto.news, after getting listed on KuCoin, Gate.io, and Bitget on March 20, TUT rallied over 330% to hit a record high of $0.057. But the rally was short-lived as within 24 hours, the token lost nearly half its value as early buyers took profits.
Still, not everyone is bearish. Technical analysts like gemxbt_agent are pointing to a bullish structure on the charts.
According to their March 27 X post, TUT recently broke out of a consolidation pattern and formed a possible double-bottom reversal. Key support was noted around $0.03, with potential upside targets between $0.06 and $0.065.
TUT price analysis
On the 4-hour chart (TUT/USDT), the price recently formed a God candle followed by a few red candles, which usually hints at some selling pressure kicking in after the pump.
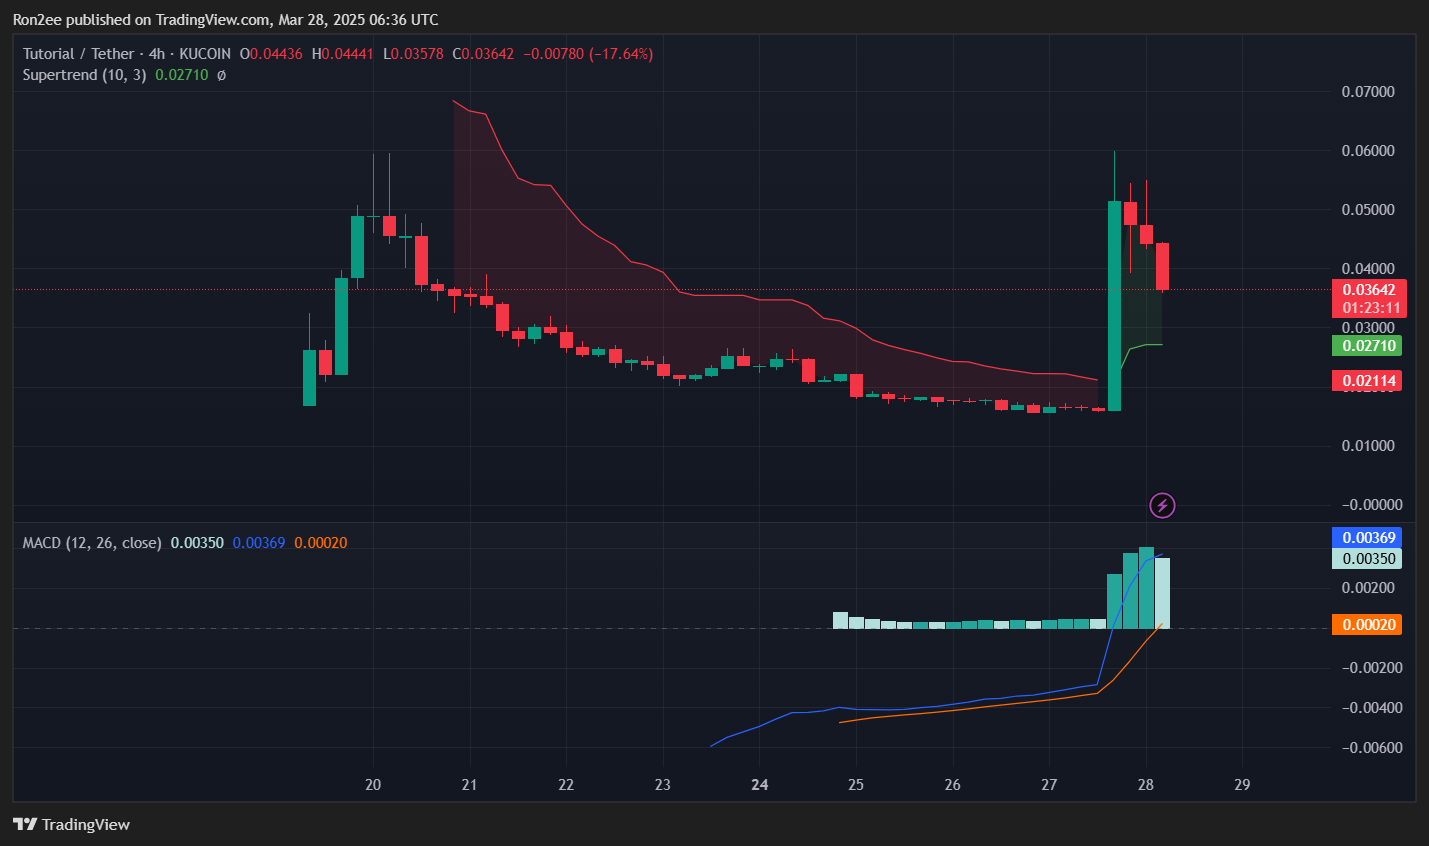 TUT price, Supertrend and MACD chart — March 28 | Source: crypto.news
Still, the Supertrend indicator just flipped green and is sitting above the price, which usually means the bullish momentum is still in play. That could open the door for another leg up.
The MACD is also looking strong, with the MACD line crossing above the signal line. On top of that, the Chaikin Money Flow is showing a positive reading, suggesting that fresh capital is still flowing into TUT.
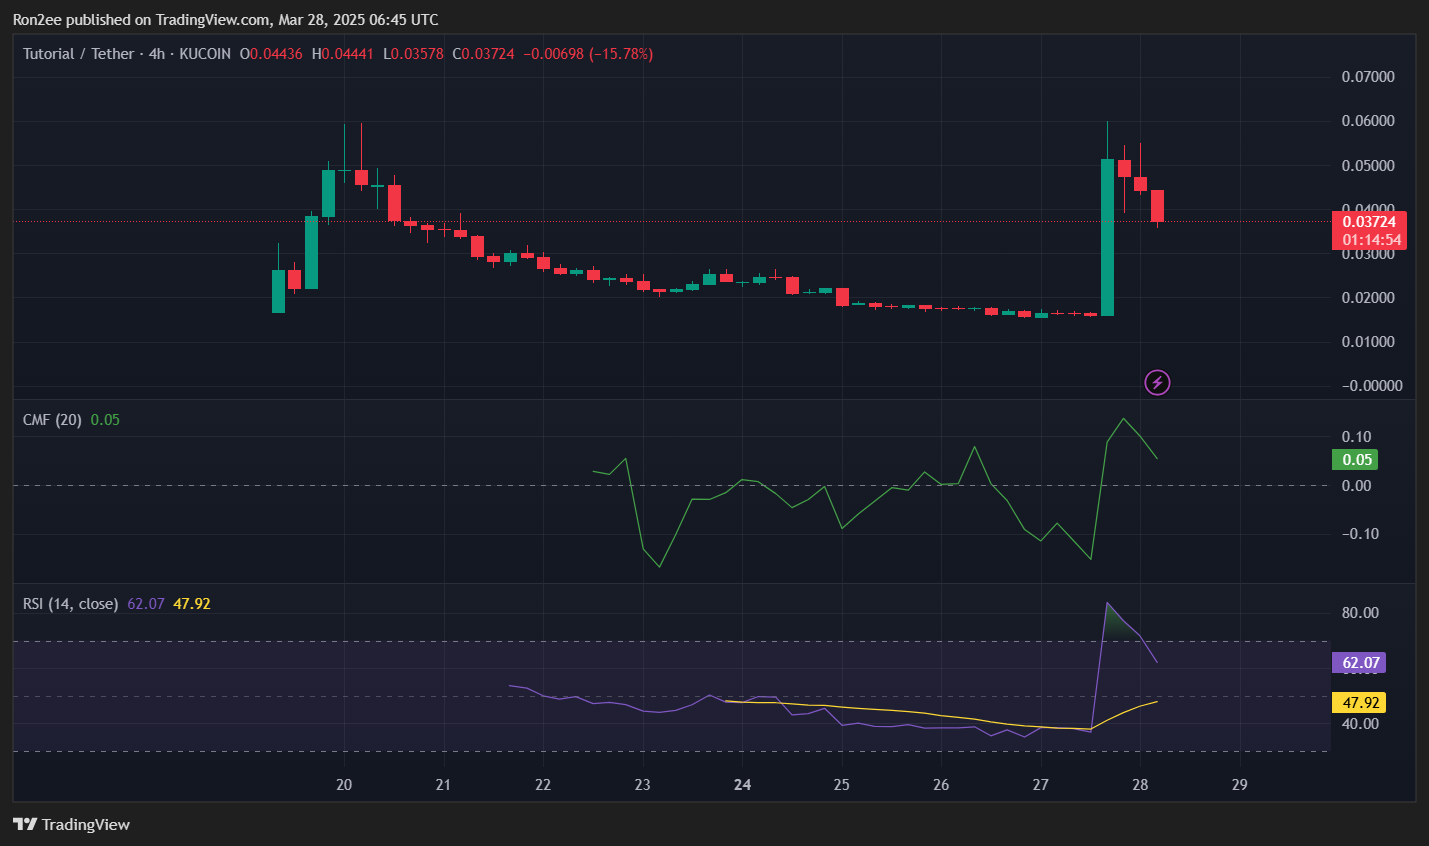 TUT CMF and RSI chart — March 28 | Source: crypto.news
Meanwhile, the RSI has cooled off a bit, dropping back to around 60 after hitting overbought levels. This means selling pressure might be fading, giving bulls more room to take control again.
If momentum continues, TUT could make another push toward the $0.06 resistance level, the same spot it struggled to break on March 20.
That said, there could be another round of selling before it gets there. Per CoinGlass, TUT’s weighted funding rate was negative at press time, meaning the majority of derivative traders were betting on a price correction.
Disclosure: This article does not represent investment advice. The content and materials featured on this page are for educational purposes only.


 English (US) ·