 4 hours ago
2
4 hours ago
2
The coming U.S. inflation data could be a defining moment for XRP price prediction. Forecasters expect the Consumer Price Index (CPI) to rise to 3.1% year-over-year—the highest in nearly a year and a half. Combined with the Federal Reserve’s plan to cut rates despite climbing prices, this mix of rising inflation and easier monetary policy could set up an unusual trading environment. Let’s break down what that means for XRP and how the chart is hinting at the next possible move.
XRP Price Prediction: Is Inflation Pressure Good or Bad for XRP?
Crypto usually benefits when real interest rates fall. If inflation rises but the Fed still cuts rates, real yields decline, and risk assets like XRP tend to get a boost. However, the market’s confidence in the Fed’s control over inflation matters. If investors start believing inflation is getting out of hand, the dollar could strengthen in the short term, creating a headwind for XRP’s dollar pair (XRP/USD).
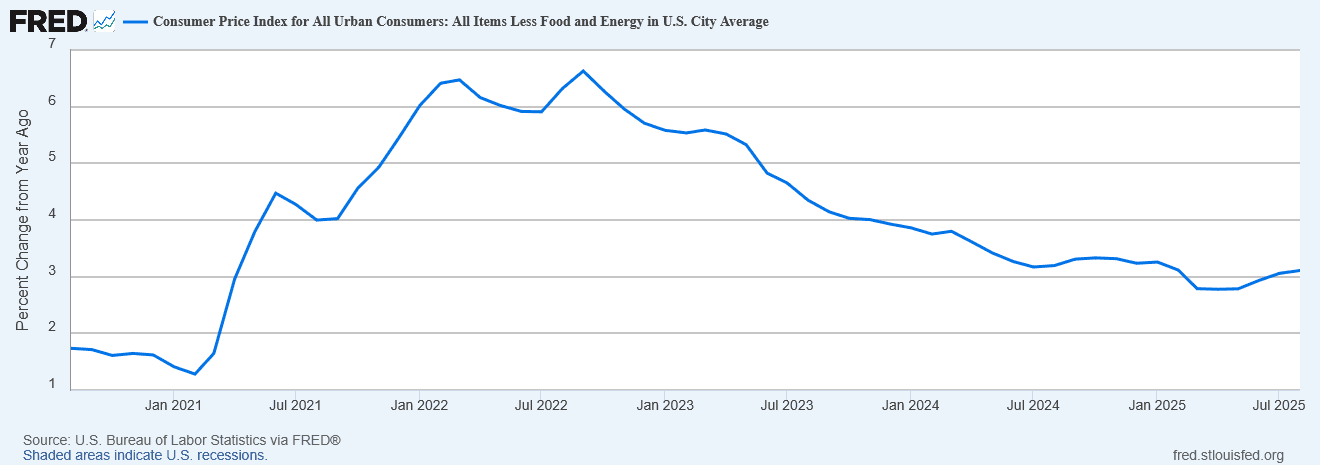
The FRED inflation chart tracks the year-over-year change in the Consumer Price Index for all urban consumers excluding food and energy. It clearly shows inflation peaking near 6.5% in 2022 before steadily falling through 2023 and early 2024.
However, since mid-2025, the curve has flattened and begun to turn slightly upward again, reflecting the recent reacceleration driven by tariffs and supply-side costs. This subtle uptick signals that the inflation cooldown phase may be over, raising concern that the U.S. economy is entering a new period of sticky inflation—a development that could shape how crypto assets like XRP price respond to macroeconomic data in the coming weeks.
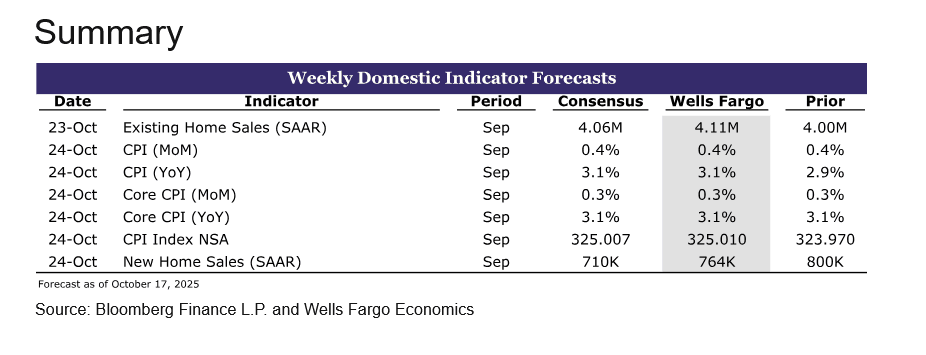
The Wells Fargo Weekly Domestic Indicator Forecast table shows that inflationary pressures are expected to stay firm with both headline and core CPI forecasted to rise 0.4% month-over-month and 3.1% year-over-year.
These figures match market consensus and suggest that inflation remains sticky despite slowing housing and consumer demand. Interestingly, Wells Fargo expects new home sales to drop from 800K to 764K, hinting that higher prices and economic uncertainty may be weighing on real estate activity. Together, these numbers paint a picture of moderate inflation persistence with weakening demand momentum—an uneasy mix for policymakers and traders alike.
XRP Price Prediction: What the Chart Is Signaling Now?
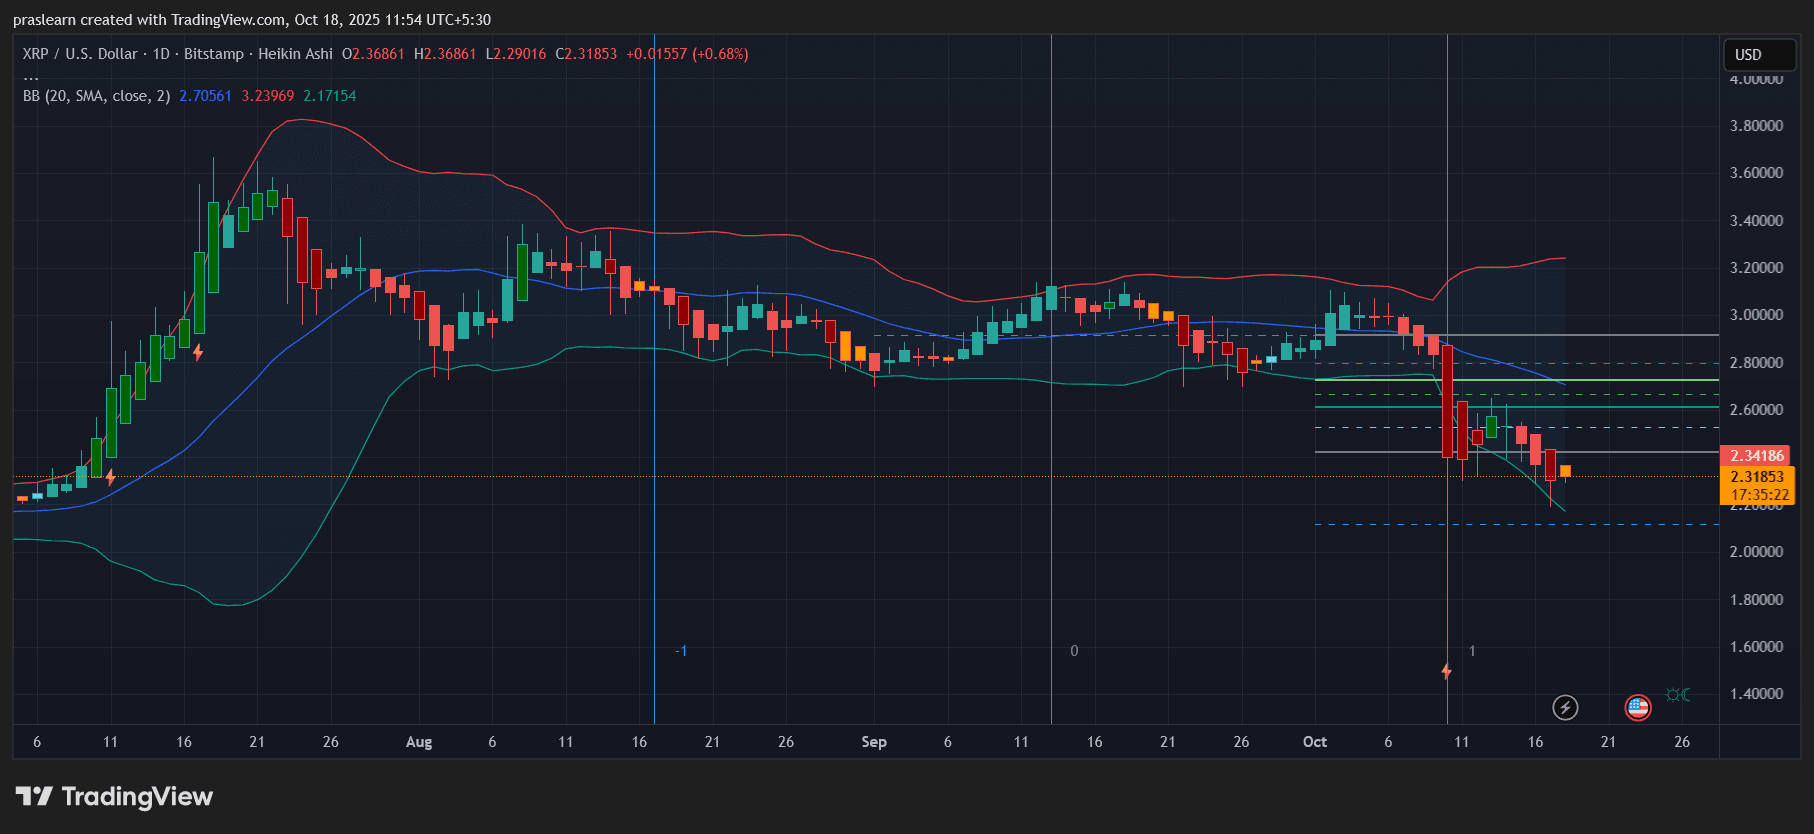 XRP/USD Daily Chart- TradingView
XRP price daily chart shows clear bearish momentum. The price has been sliding along the lower Bollinger Band, currently hovering around 2.31 USD. This behavior indicates persistent selling pressure without a clean reversal yet.
The mid-band (20-day simple moving average) sits near 2.70 USD—now acting as resistance. Price rejection around this level would confirm the continuation of a short-term downtrend. The recent sequence of long red Heikin Ashi candles followed by smaller-bodied ones suggests selling exhaustion might be near, but not complete.
Below current levels, the 2.20 USD zone marks immediate support. A decisive breakdown could send XRP toward 2.00 USD, where psychological support might kick in. On the upside, XRP needs to close above 2.60 USD to attract renewed bullish momentum. Without that, the chart remains structurally weak.
Could the CPI Report Trigger a Reversal?
The CPI report due Friday could jolt volatility across crypto markets. If inflation prints exactly as expected or slightly lower (under 3.1%), markets will likely price in a stronger case for the Fed’s October rate cut. That scenario could push XRP toward the 2.50–2.60 USD range in a relief rally.
But if CPI surprises higher—say, 3.3% or more—traders may start doubting the Fed’s willingness to keep cutting rates amid sticky inflation. In that case, risk assets could see renewed pressure, sending XRP back below 2.20 USD.
So, it’s a classic binary setup: soft inflation equals short-term bullish reversal, higher inflation equals continued downside.
Market Sentiment and Macro Backdrop
XRP’s fundamental narrative—its ongoing legal clarity post-SEC ruling and growing use in cross-border settlements—remains intact, but right now, macro sentiment is the dominant driver. A weakening labor market combined with higher inflation creates uncertainty that traders usually hate. Until macro clarity returns, XRP could remain trapped in the 2.00–2.70 USD range.
Also, note that Bitcoin dominance has ticked higher over the past week, suggesting capital is rotating away from altcoins like XRP toward safer large-cap plays. That trend typically continues until major economic data surprises positively.
XRP Price Prediction: What Happens Next?
Short term, XRP price is at an inflection point. The 2.20–2.40 USD zone will determine whether the next move is a deeper slide or a relief bounce.
- Bullish scenario: CPI comes in at or below 3.1%, the Fed maintains dovish tone → XRP could rebound toward 2.60–2.70 USD.
- Bearish scenario: CPI exceeds 3.2%, inflation fears dominate → XRP could revisit 2.00 USD or even dip to 1.85 USD before finding buyers.
The broader takeaway is that this week’s inflation report will likely decide whether XRP stabilizes or breaks down further. Until then, traders should watch volatility spikes and Bollinger Band compression closely—the squeeze forming now often precedes explosive moves in either direction.
If inflation cools just enough for the Fed to stay dovish, $XRP could finally catch a bid next week. But if the report fuels doubts about the Fed’s credibility, XRP’s correction isn’t done yet. This CPI release isn’t just another data point—it’s the pivot that could set XRP’s direction for the rest of October.


 English (US) ·