 1 month ago
26
1 month ago
26
The information provided in this article is for informational purposes only and does not constitute financial advice. Cryptocurrency investments carry a high degree of risk. Always conduct your own research.
XRP price is tumbling alongside Bitcoin as geopolitical tensions in the Middle East and a massive options expiry trigger a broad crypto market sell-off today.

XRP Crash Today
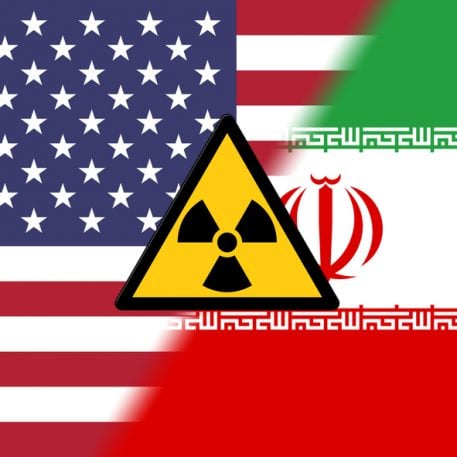
The cryptocurrency market is facing a brutal deleveraging event on March 27, 2026, and Ripple’s $XRP is caught directly in the crossfire. While XRP often charts its own path due to legal developments, it remains tethered to the "gravity" of Bitcoin. Today, that gravity is pulling sharply downward as a combination of a massive $14 billion Bitcoin options expiry and the escalating Iran-Israel conflict drains liquidity from risk assets.

Why is XRP Price Crashing?
To understand the XRP crash, one must look at Bitcoin ($BTC). The market is currently digesting the quarterly options expiry, which saw billions in open interest settled. Historically, these events lead to heightened volatility as market makers hedge their positions.
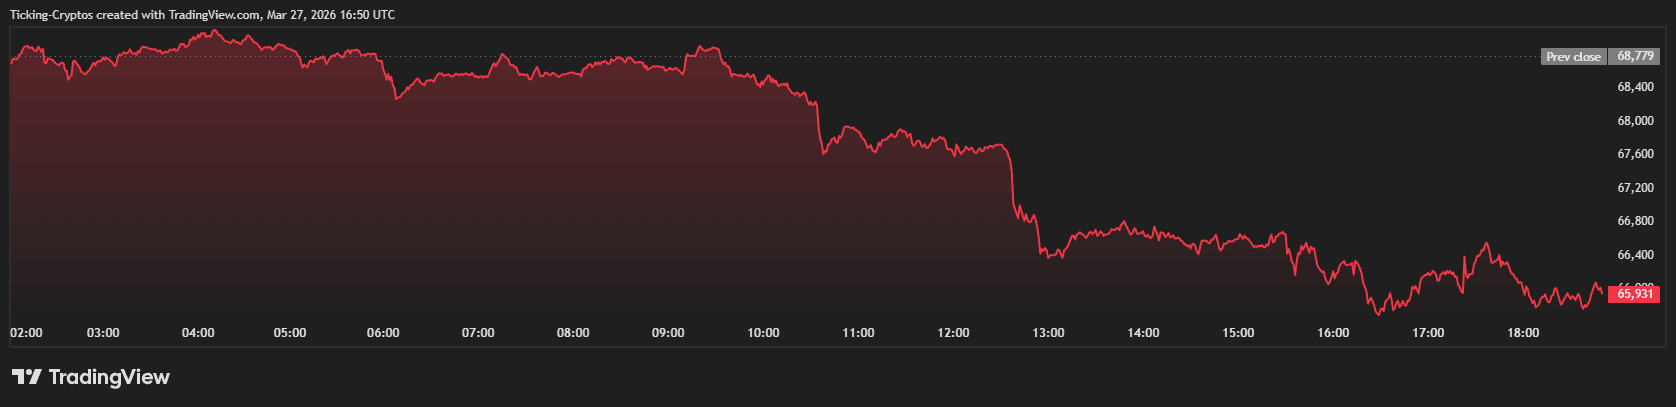 Bitcoin Price in USD crashing today
Simultaneously, as reported by Reuters, the threat of a full-scale regional war has spiked oil prices, leading investors to dump "risk-on" assets like XRP in favor of cash and gold. Because XRP maintains a high positive correlation with BTC, the 4% drop in Bitcoin has translated into an even steeper decline for Ripple's native token.
XRP Price Analysis: is XRP REALLY Crashing?
If we look at the 3-hour XRP/USD chart below, we see a typical "break and retest" of bearish momentum. The technicals are currently screaming caution.
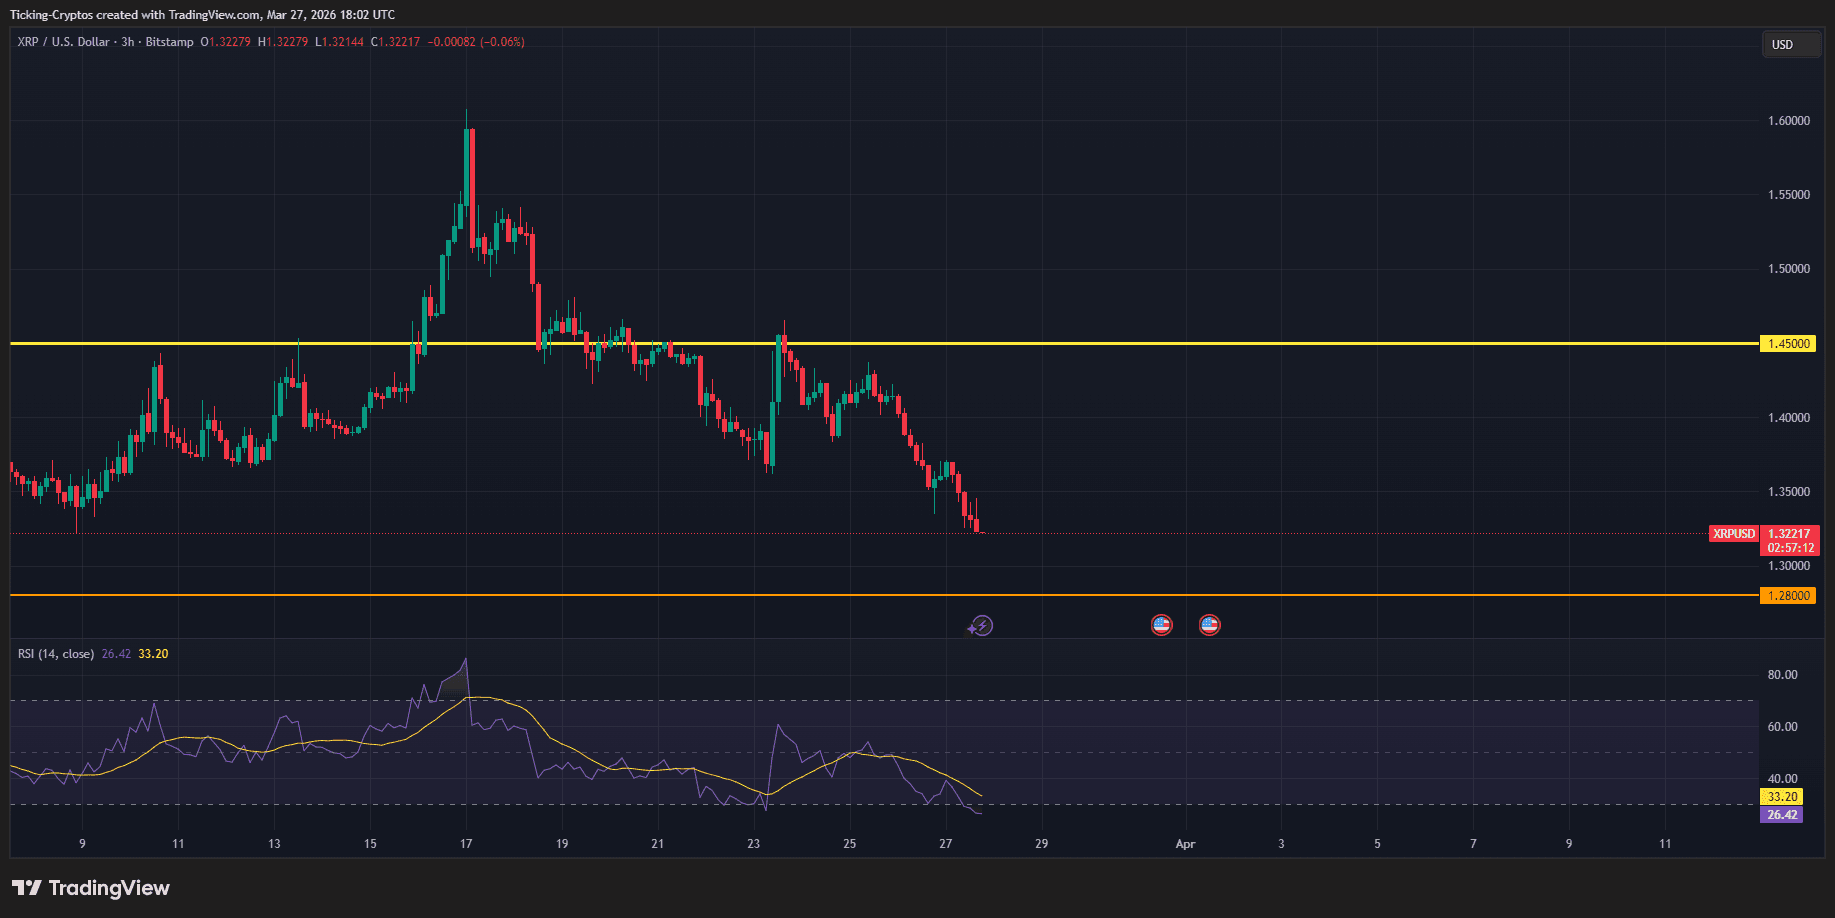
- Support & Resistance Flip: XRP has decisively broken below the critical psychological and structural support at $1.45. This level, which acted as a floor throughout mid-March, has now transitioned into a formidable resistance zone.
- The Descent to $1.28: The price is currently in a "free-fall" zone with no significant historical volume profile support until the $1.28 mark. This yellow horizontal line represents the "Value Area Low" where buyers have historically stepped in.
- RSI Oversold Signal: The Relative Strength Index (RSI) is currently printing at 26.42. In professional trading, any reading below 30 is considered "oversold." While this suggests a "dead cat bounce" or a relief rally could occur soon, in a high-volatility war environment, RSI can remain "embedded" in oversold territory for extended periods.
Correlation and Systematic Risk
The chart shows a series of lower highs and lower lows starting from the March 17 peak of nearly $1.60. This downward channel is a direct reflection of systematic risk entering the market. Institutional desks are likely reducing their exposure to XRP not because of Ripple-specific news, but as part of a broader "de-risking" strategy.
Strategic Outlook
If the $1.28 support holds, we could see a period of consolidation. However, a break below this level could open the trapdoor toward $1.10.


 English (US) ·