 1 day ago
5
1 day ago
5
Reason to trust
![]()
Strict editorial policy that focuses on accuracy, relevance, and impartiality
Created by industry experts and meticulously reviewed
The highest standards in reporting and publishing
Strict editorial policy that focuses on accuracy, relevance, and impartiality
Morbi pretium leo et nisl aliquam mollis. Quisque arcu lorem, ultricies quis pellentesque nec, ullamcorper eu odio.
Crypto market analyst Dr Cat (@DoctorCatX) has declared XRP the strongest chart in the entire crypto space, citing Ichimoku Cloud dynamics that currently favor XRP over both Bitcoin and major altcoins such as Ethereum.
XRP Is The ‘Strongest Chart’
In a weekly comparison of XRP/USD and BTC/USD, Dr Cat explains that XRP continues to exhibit full bullish structure within the Ichimoku framework. On the weekly chart, XRP is holding above the Kijun-Sen (base line), and the Tenkan-Sen (conversion line) remains above both price and Kijun, maintaining a textbook bullish configuration. The price, marked at $2.09688, has now consolidated for multiple weeks above the Kijun, with no significant violations.
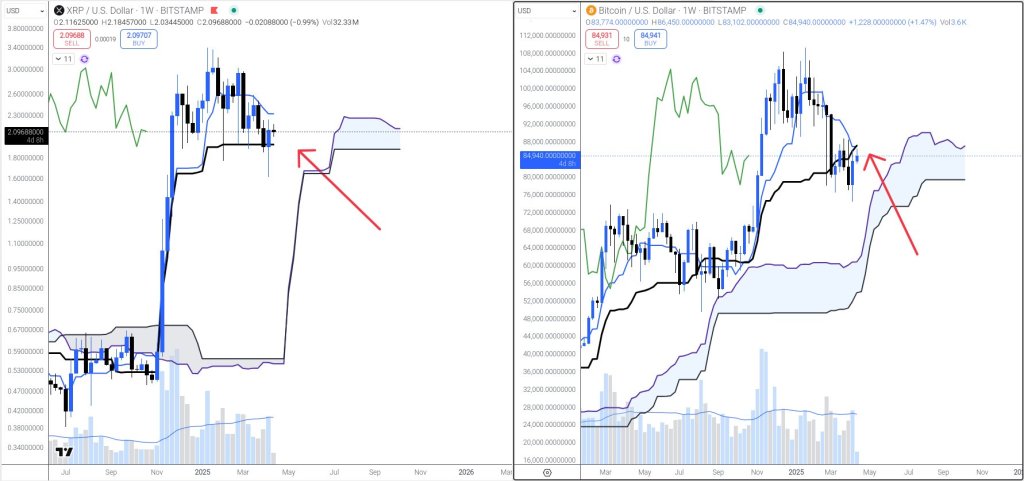 XRP Ichimoku analysis | Source: X @DoctorCatX
The Ichimoku cloud projected ahead — the Kumo — shows a sharply rising Senkō Span A, forming an upward-sloping top to the cloud that extends into May. Senkō Span B is positioned lower and flat, adding to the positive slope of the cloud. This forward structure typically reflects underlying trend strength. While precise values for these lines are not labelled on the chart, their shape and relative positioning confirm that the cloud is bullishly aligned, with Span A above Span B, and rising — a configuration often preceding strong continuation moves.
In contrast, the BTC/USD weekly chart presents a more fragile picture. While Bitcoin trades at $84,940, and remains above the Kumo, it has lost the Kijun-Sen, with price slipping below that critical baseline over the last two candles. Moreover, the Tenkan-Sen has crossed beneath the Kijun-Sen, forming a classic bearish crossover. Even if this crossover eventually proves to be a whipsaw, it is technically significant, as Dr Cat notes: “Even if a fake one, it’s a score point for bears that needs to be overcome.”
Dr Cat summarizes the contrast across the majors as follows: “Plenty of altcoins are already in a bear market on the weekly, including ETH. BTC is struggling to fight back. But XRP bulls still have full control.” In response to users speculating on timelines, tops, and price targets — some calling for $0.80 retracements, others for new all-time highs imminently — the analyst replied: “By the end of May it should be pretty clear.”
Dr Cat has also reiterated his medium-term upside target of $4.50 for XRP, suggesting that the setup may culminate in a full-scale breakout attempt toward or beyond the all-time high near $3.84. That move, however, remains contingent on bulls maintaining their current technical advantage.
XRP Sets New Record Against Ethereum
Additional evidence of XRP’s rising strength comes from independent analyst Dom (@traderview2), who published a historical performance heatmap comparing XRP to ETH on a monthly basis. His data shows that XRP has now outperformed ETH for five consecutive months (entering the six month) — the longest such streak ever recorded.
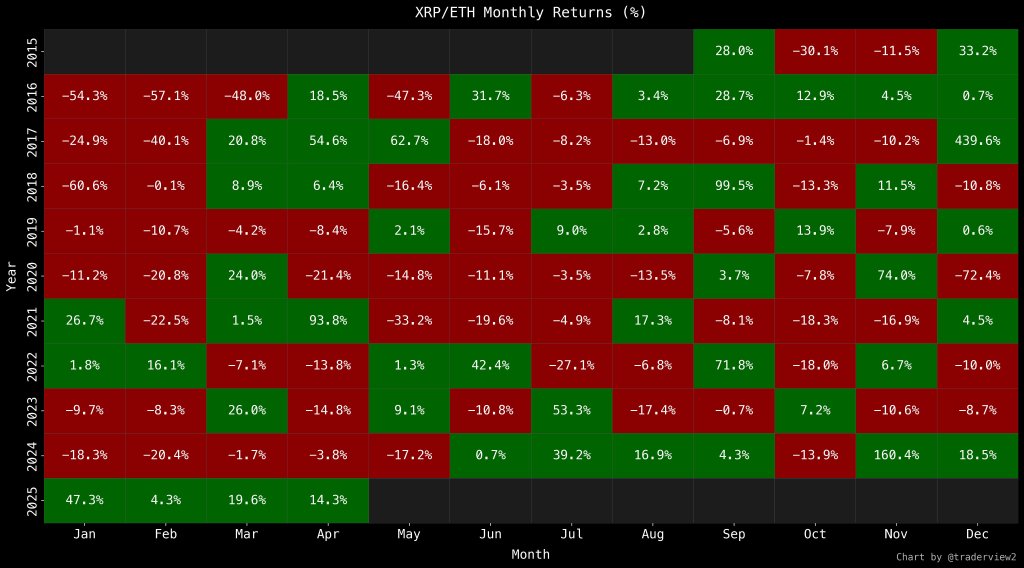 XRP/ETH Monthly Returns | Source: X @traderview2
The outperformance began in November 2024, with XRP gaining +160.4% relative to ETH, followed by +18.5% in December, +47.3% in January, +4.3% in February, +19.6% in March, and +14.3% so far in April 2025. Prior to this run, the longest relative win streak had been four months (June–September 2024), making the current stretch a historical first. The cumulative arithmetic gain across this period exceeds +264%, showcasing a sustained capital rotation toward XRP not seen in prior cycles.
While it remains to be seen whether the current strength translates into new highs, XRP’s chart structure is unmatched across major tokens on the weekly timeframe. With a clean bullish alignment, a rising cloud, and dominant relative performance, Dr Cat’s conclusion remains firmly grounded: “XRP bulls still have full control.”
At press time, XRP traded at $2.09.
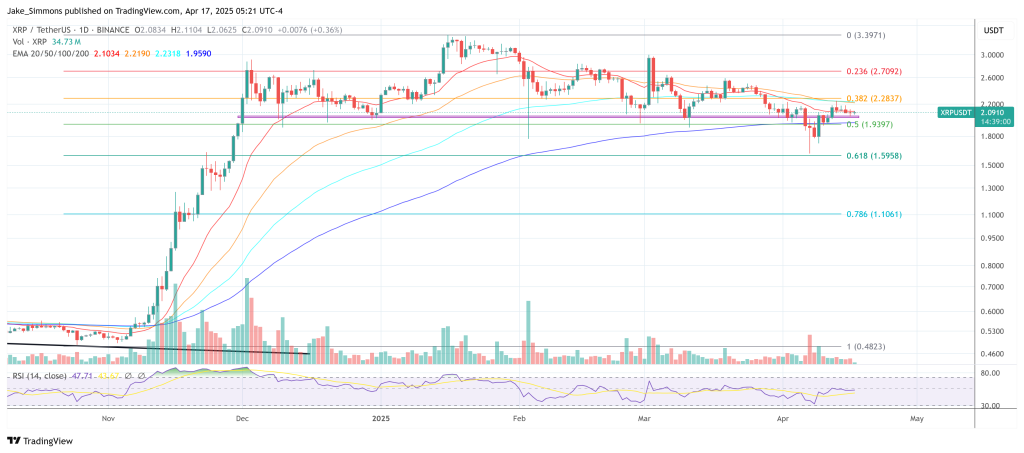 XRP trades above key support, 1-day chart | Source: XRPUSDT on TradingView.com
Featured image created with DALL.E, chart from TradingView.com


 English (US) ·