XRP price has remained in a consolidation phase for the past two weeks as investors remain in a risk-off mood, weighed by the uncertainty of when ongoing geopolitical tensions ease.
Summary
- XRP price remains range-bound between $1.25 and $1.40 for over two weeks, down nearly 16% from its March high as risk-off sentiment persists.
- Rising exchange inflows and $6 billion in whale selling since October signal continued selling pressure, while futures open interest remains subdued.
- Bearish technicals point to a potential drop toward $1.12, though some analysts see a long-term breakout that could drive a major upside move.
According to data from crypto.news, XRP (XRP) price has been trading within the $1.25 to $1.40 range for more than two weeks. Trading at $1.33 at press time, the 4th largest crypto asset by market cap has fallen nearly 16% from its March high.
XRP price crashed shortly after the U.S. SEC and CFTC jointly classified XRP as a digital commodity on March 17, ending years of legal uncertainty from the SEC lawsuit and shifting primary oversight to the CFTC.
Despite the bullish news, once it surfaced, many investors sold the news to lock in profits, which created very strong selling pressure on the XRP token.
Third-party data shows whales have been systematically selling their holdings since October last year. These whales have dumped an estimated $6 billion worth of XRP since then, as they used every price bounce as an opportunity to exit their positions.
The token’s price has also been suppressed by the tension in the Middle East, which has lowered investor risk appetite and impacted the broader crypto market.
It continues to remain at risk of more downside as investors continue to move their XRP holdings to exchanges. Data from CoinGlass shows that nearly $160 million worth of XRP has been moved to exchanges over the past two days. If these investors were to sell their coins, it could trigger a deeper correction.
This comes as the open interest in the XRP futures market has been stalling around $2 to $3 billion for more than a month now, significantly lower than the $9 billion level recorded in October last year, a sign that derivatives traders have lost interest in the token.
The daily XRP chart suggests that the token could be set for more downside in the short term. Notably, the 20-day SMA has formed a bearish crossover with the 50-day SMA, a sign that momentum is turning bearish.
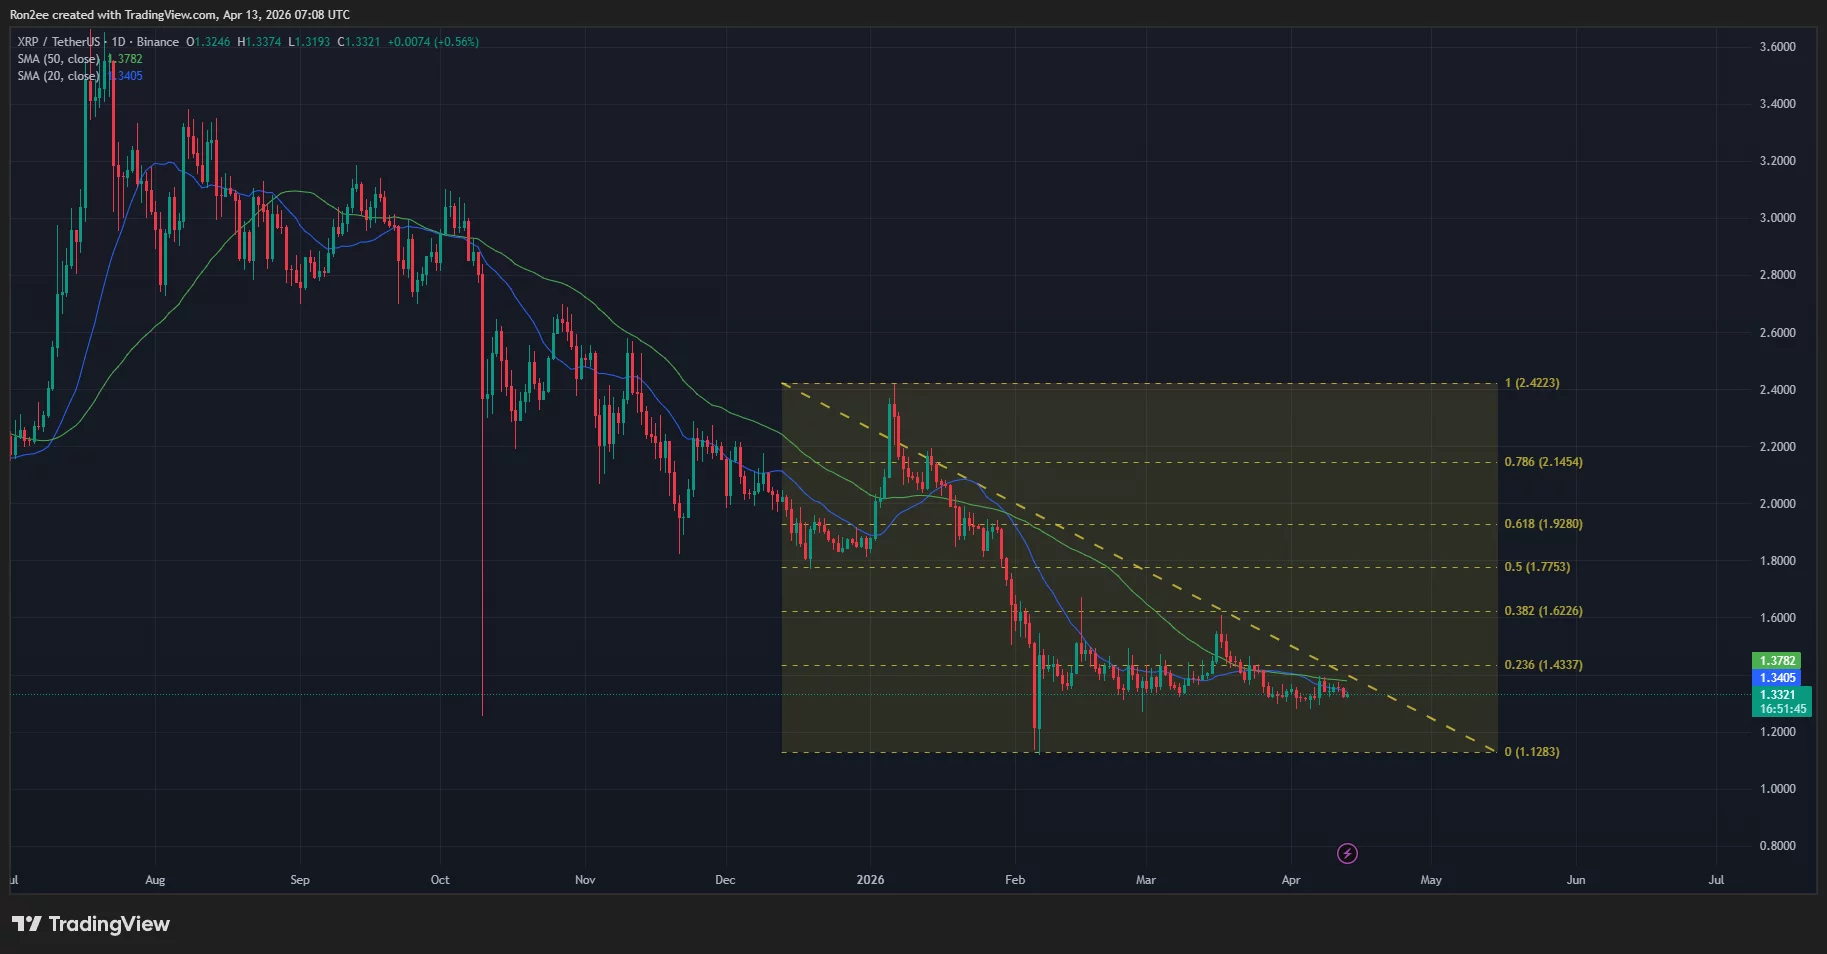 XRP price, 20-day and 50-day SMA chart — April 13 | Source: crypto.news
XRP price has also slipped below the last line of defense at $1.43, which represents the 23.6% Fibonacci retracement level drawn from the Jan. 6 high to the Feb. 5 low.
Adding to this, the supertrend indicator has flipped red, and the RSI has dropped below the neutral threshold. Hence, XRP price stands at risk of dropping to the Feb. 5 low of $1.12, with the breach of this support potentially further accelerating the slide towards the $1.00 psychological level.
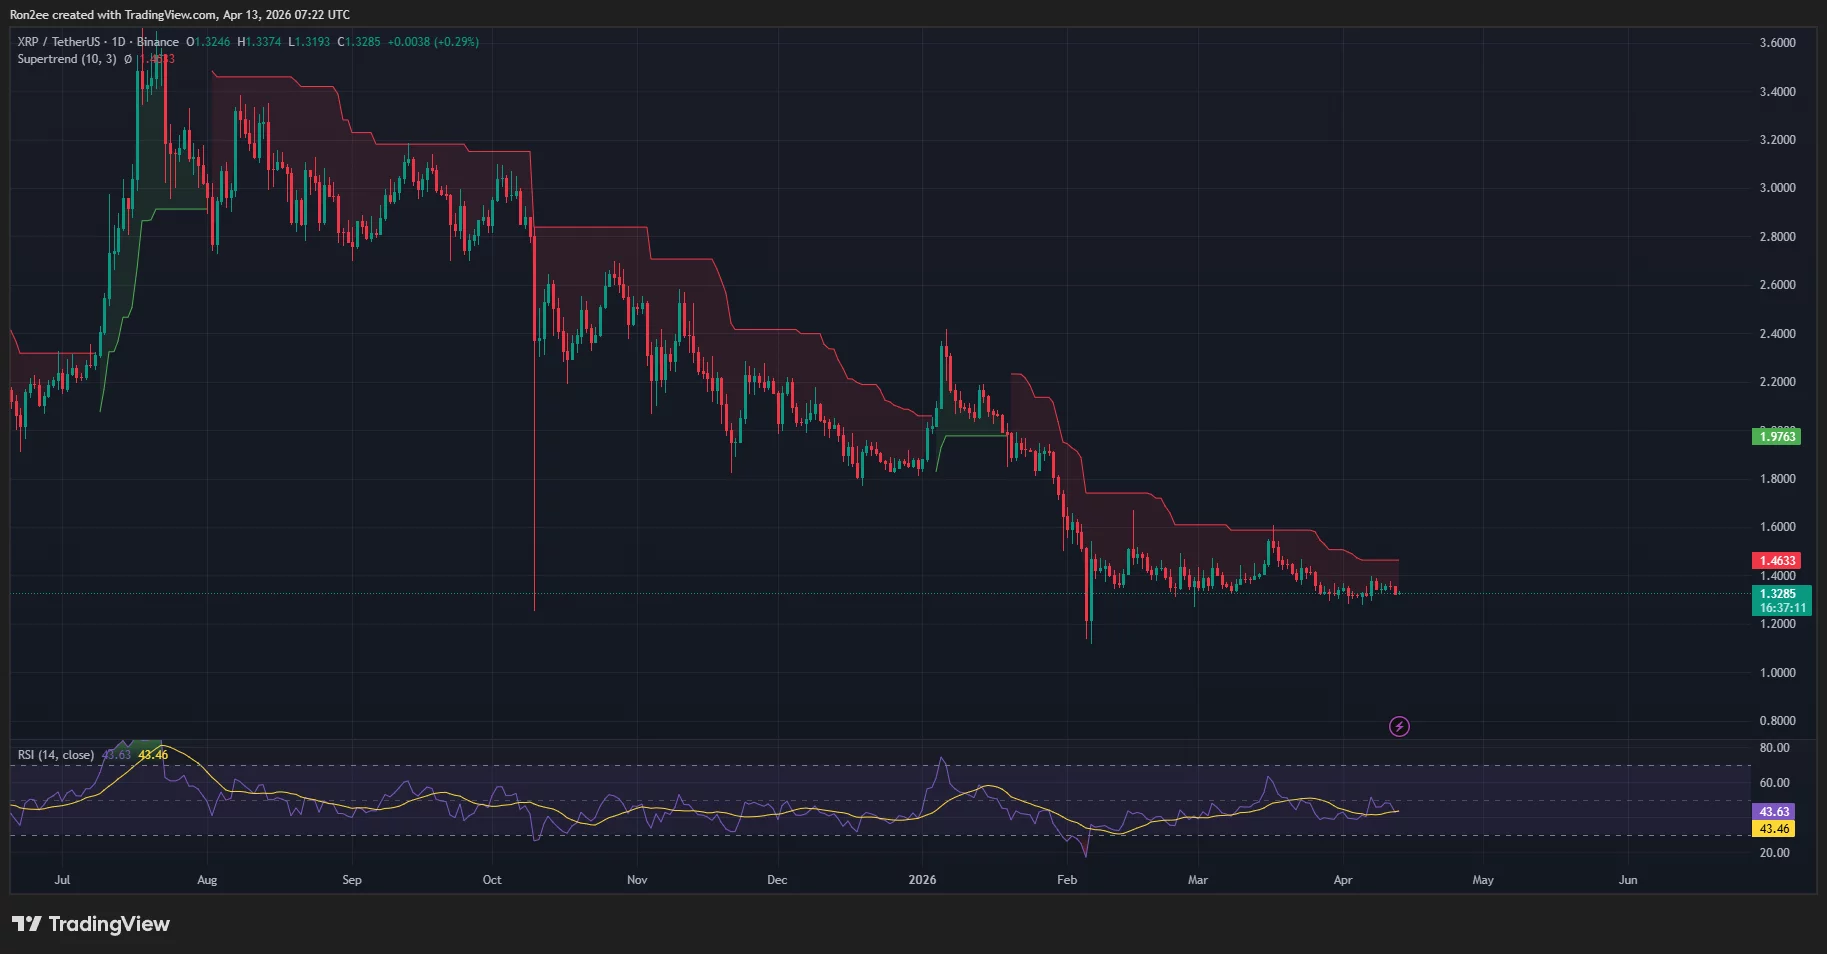 XRP price, Supertrend, and RSI chart — April 13 | Source: crypto.news
Despite the bearish outlook presented by the XRP chart in the short term, some analysts maintain a bullish perspective over a longer time frame.
In a recent X post by analyst Ali Martinez, he expects the XRP token to rebound by over 500% over the coming months if it successfully breaks out of a descending triangle pattern that has been developing on the monthly timeframe for nearly nine years. See below:
The next $XRP bull market will be huge!
XRP is currently trading inside a giant 9-year ascending triangle on the monthly chart. Since 2017, the script has remained the same: XRP hits the upper resistance (X-axis), gets rejected, and retraces to find its floor at the rising… pic.twitter.com/bMJ7q582Id
Disclosure: This article does not represent investment advice. The content and materials featured on this page are for educational purposes only.


 English (US) ·