 1 month ago
32
1 month ago
32
XRP Price Prediction: Why the $2.00 Level is the Next Major Target
Current market data suggests that a return to the $2 level is a high-probability target supported by record-low exchange liquidity, massive spot ETF inflows, and the integration of the $XRP Ledger into global financial infrastructure. As of March 11, 2026, XRP is trading in a "coil" formation that often precedes a violent breakout. Breaking above the 200-day Moving Average is the technical trigger required to turn this psychological resistance into a launchpad for further gains.
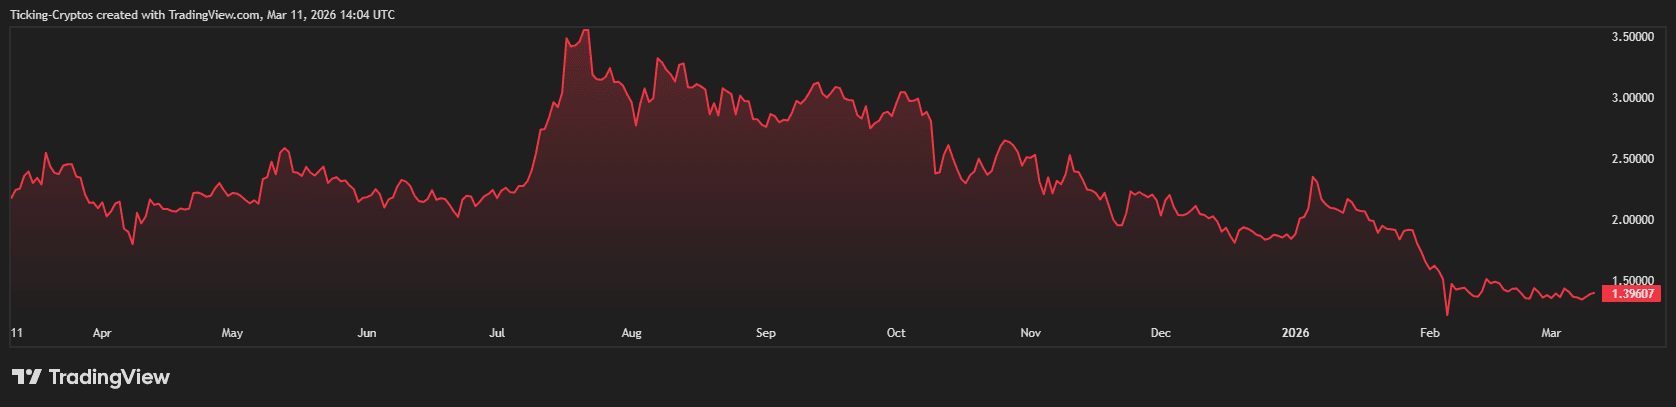 XRP Price over the past year
Understanding XRP Liquidity Magnets and Market Structure
To understand the $2 target, one must look at market structure and liquidity magnets. In trading, a "liquidity magnet" refers to a price zone where a large cluster of orders (often liquidations) resides. For XRP, the $2.00 to $2.20 range represents a massive area of short-position liquidations. If the price of $XRP moves into this zone, a "short squeeze" could rapidly accelerate the rally beyond previous resistance levels.
1. Institutional Infrastructure: The Ripple Prime Effect
The most significant fundamental driver for XRP in 2026 is its transition from a speculative asset to a core piece of financial infrastructure. Following its acquisition of several fintech firms in 2025, Ripple has launched Ripple Prime, a unified institutional platform.
On March 2, 2026, it was revealed that Ripple Prime's integration with major clearing houses has begun routing institutional post-trade volumes directly onto the XRP Ledger. This provides a fundamental "floor" for the price as the network begins processing real-world transaction volume rather than just retail speculation.
2. Institutional Inflows via Spot XRP ETFs
Since the landmark approval of Spot XRP ETFs, institutional adoption has accelerated. As of this week, XRP ETFs have surpassed $1.44 billion in cumulative inflows. Notably, banking giants like Goldman Sachs have emerged as top holders, signaling that the "smart money" is positioning for long-term appreciation.
According to recent reports from Nasdaq, the elimination of the SEC legal overhang in late 2025 allowed conservative wealth managers to finally include XRP in their digital asset portfolios. This persistent buying effectively reduces the circulating supply on exchanges, creating a supply-demand imbalance that favors the bulls.
3. Technical Breakout and Symmetrical Triangle Compression
From a technical standpoint, XRP is currently testing the apex of a massive symmetrical triangle on the daily chart. Historically, such compressions lead to significant price expansions.
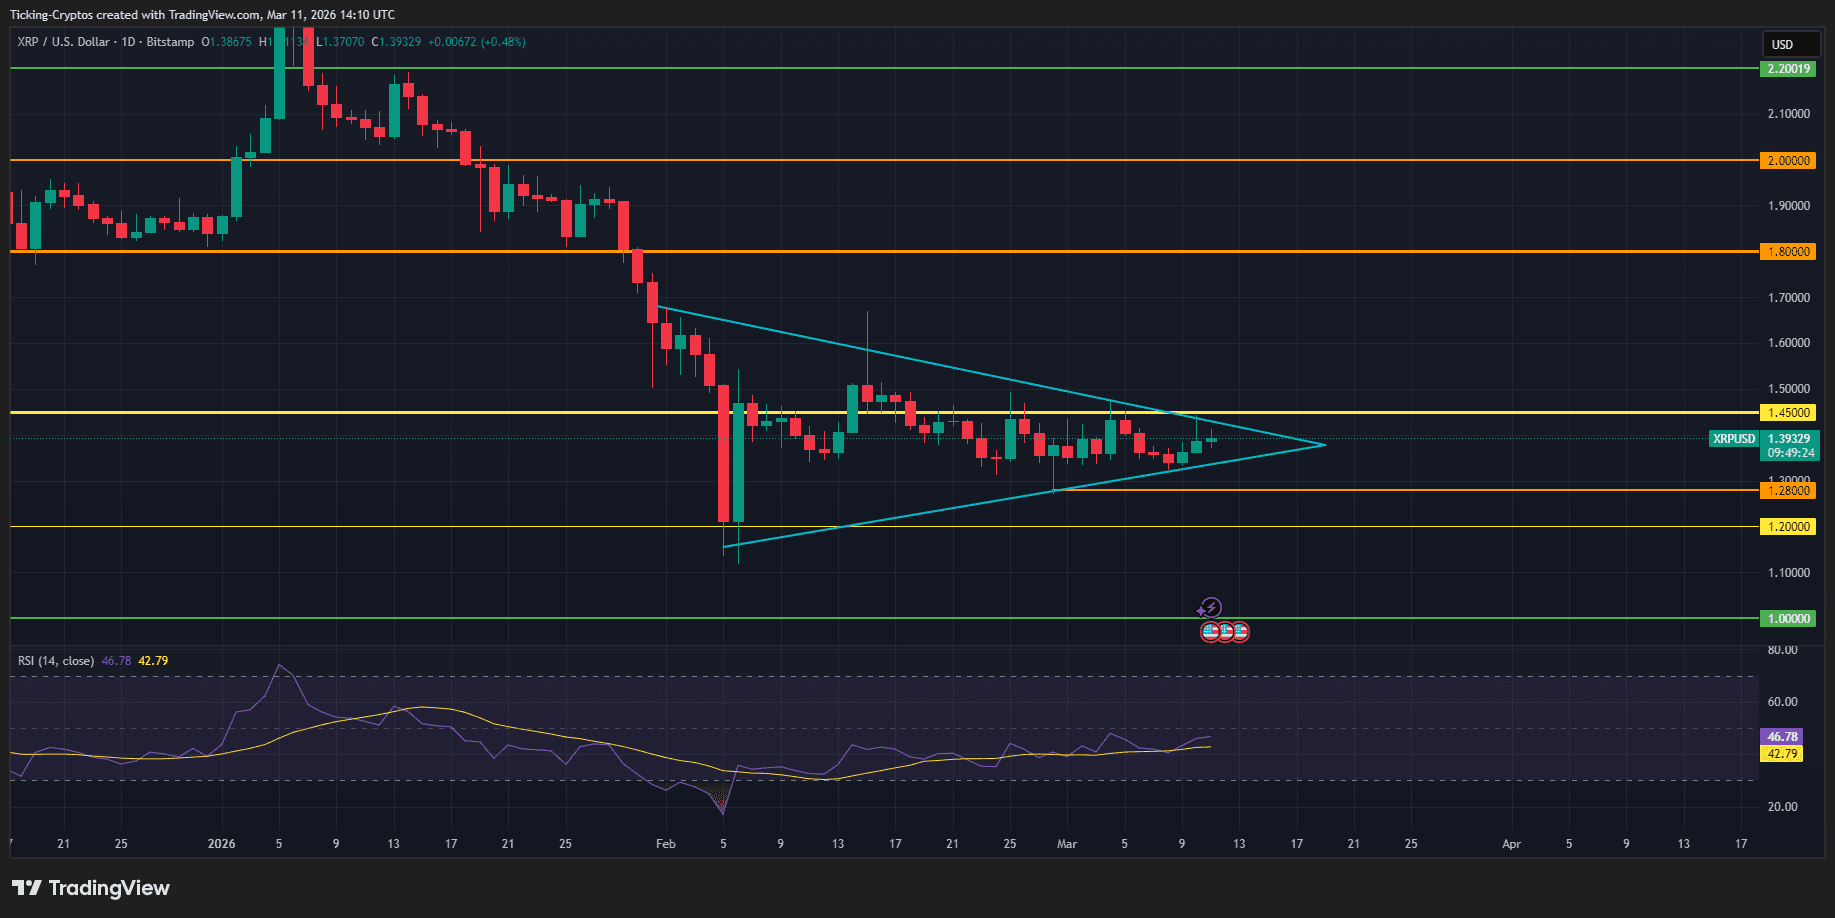
- RSI Bullish Divergence: While price has stayed flat, the Relative Strength Index (RSI) is making higher lows, suggesting hidden strength.
- Exchange Balances: XRP held on centralized exchanges has hit a 3-year low, according to CryptoQuant data.
- Network Activity: The XRP Ledger recently hit 2.7 million daily transactions, a record high that proves network utility is outpacing price action.
XRP Resistance Levels and Support Zones for 2026
To track the progress toward the $2 target, investors should monitor the following support and resistance zones:
| Immediate Support | $1.30 | Critical floor; must hold to maintain bull bias |
| Local Resistance | $1.50 | Major psychological hurdle for retail traders |
| The Bull Target | $2.00 | Breakout confirmation & short-squeeze trigger |
| Cycle Peak Target | $3.80+ | Previous All-Time High (ATH) retest |
XRP Future Outlook: The Impact of the Digital Asset Market Clarity Act
While the path to $2 seems clear, investors must remain aware of broader macro risks. The upcoming US Digital Asset Market Clarity Act vote later this month will be the final piece of the puzzle. A "Yes" vote would provide the ultimate regulatory green light, likely triggering the final surge past $2.00.


 English (US) ·