Bitcoin (BTC) ignored geopolitical volatility on Sunday as traders waited for markets’ Iran reaction.
Key points:
Bitcoin coils around $67,000 as the dust settles on a wild weekend in the Middle East.
TradFi market reactions are in focus, with BTC price action avoiding major volatility.
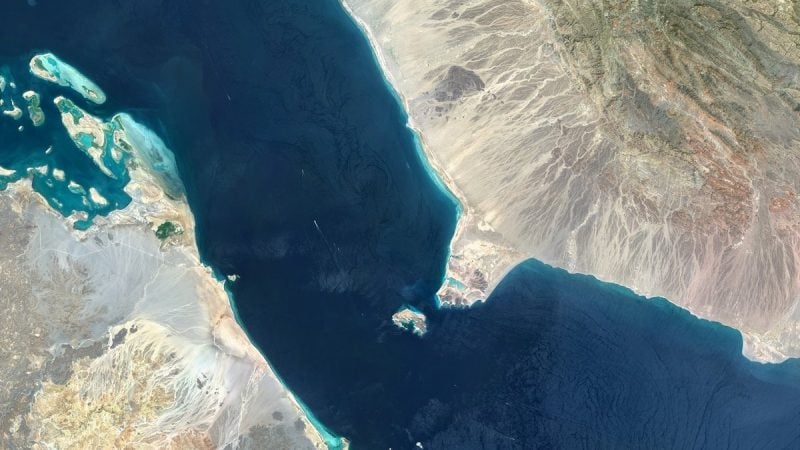
Oil price concerns compound as Iran seeks to close the Strait of Hormuz.
Trader sees $74,000 BTC price rally
Data from TradingView showed BTC price action focusing on $67,000 in the aftermath of the latest round of conflict in the Middle East.
 BTC/USD one-hour chart. Source: Cointelegraph/TradingView
The weekend prevented TradFi markets from adjusting to events in real time, with US stock market futures down 0.65% at the time of writing.
Crypto also saw volatility, but soon cooled, and BTC/USD avoided a major breakout from its local trading range.
Commenting, crypto trader, analyst and entrepreneur Michaël van de Poppe described the initial response as “positive.”
“Now, markets are correcting back down, as there's uncertainty on how US markets will open tomorrow (and there's still an outstanding gap of the CME),” he wrote in a post on X.
“On the other hand, the 21-Day MA needs to break in order to have a relief rally. I think we'll see it in March/April, question of how we're opening the markets tomorrow and whether it finds a higher low.” BTC/USD one-day chart. Source: Michaël van de Poppe
Van de Poppe referred to Bitcoin’s 21-day simple moving average at $67,627. The weekend’s “gap” in CME Group’s Bitcoin futures market lay to the downside at $65,880.
“$BTC looks good in the short-term,” trader BitBull agreed about the three-day chart.
“Deviation below the support zone and has now flipped resistance into support. I think a rally towards the $73K-$74K level could happen.” BTC/USDT three-day chart. Source: BitBull/X
Some argued that geopolitical instability had been “priced in” by the market in advance, explaining the comparatively modest price action over the weekend.
“We will probably move side ways the next days…,” trader Crypto Caesar concluded.
 BTC/USDT one-day chart. Source: Crypto Caesar/X
Strait of Hormuz tied to next US inflation spike
A separate point of concern focused on potential oil price volatility as Iran claimed to be closing the Strait of Hormuz.
Related: Bitcoin historical price metric sees $122K ‘average return’ over 10 months
Despite being international waters, the Strait became a holding ground for oil shipping on Sunday, leading to swift analysis of the knock-on effect for US inflation.
Trading resource The Kobeissi Letter referenced research by JPMorgan while suggesting that the Consumer Price Index (CPI) could jump to 5%.
“The last time we saw US inflation at 5% was in March 2023, when the Fed was aggressively hiking rates,” it wrote in a dedicated X thread.
 US CPI 12-month % change. Source: Bureau of Labor Statistics
As Cointelegraph reported, recent US inflation prints outpaced expectations, notably Friday’s Producer Price Index (PPI) numbers.
This article does not contain investment advice or recommendations. Every investment and trading move involves risk, and readers should conduct their own research when making a decision. While we strive to provide accurate and timely information, Cointelegraph does not guarantee the accuracy, completeness, or reliability of any information in this article. This article may contain forward-looking statements that are subject to risks and uncertainties. Cointelegraph will not be liable for any loss or damage arising from your reliance on this information.


 English (US) ·